
(b) Mid data
Results and Discussion
Through a series of descriptions of the field environment and explanation of test processes, this study takes the lecture hall as an example, and uses relevant software to simulate the test providing data for discussion. However, due to the lack of noise control in the field environment, the results may be biased to some extent. Therefore, in the future, more research should be implemented on the means of noise control in the space, so as to effectively control the noise environment and ensure the reliability of test results.
Micro-porous Structure of the Volcanic Rock Material
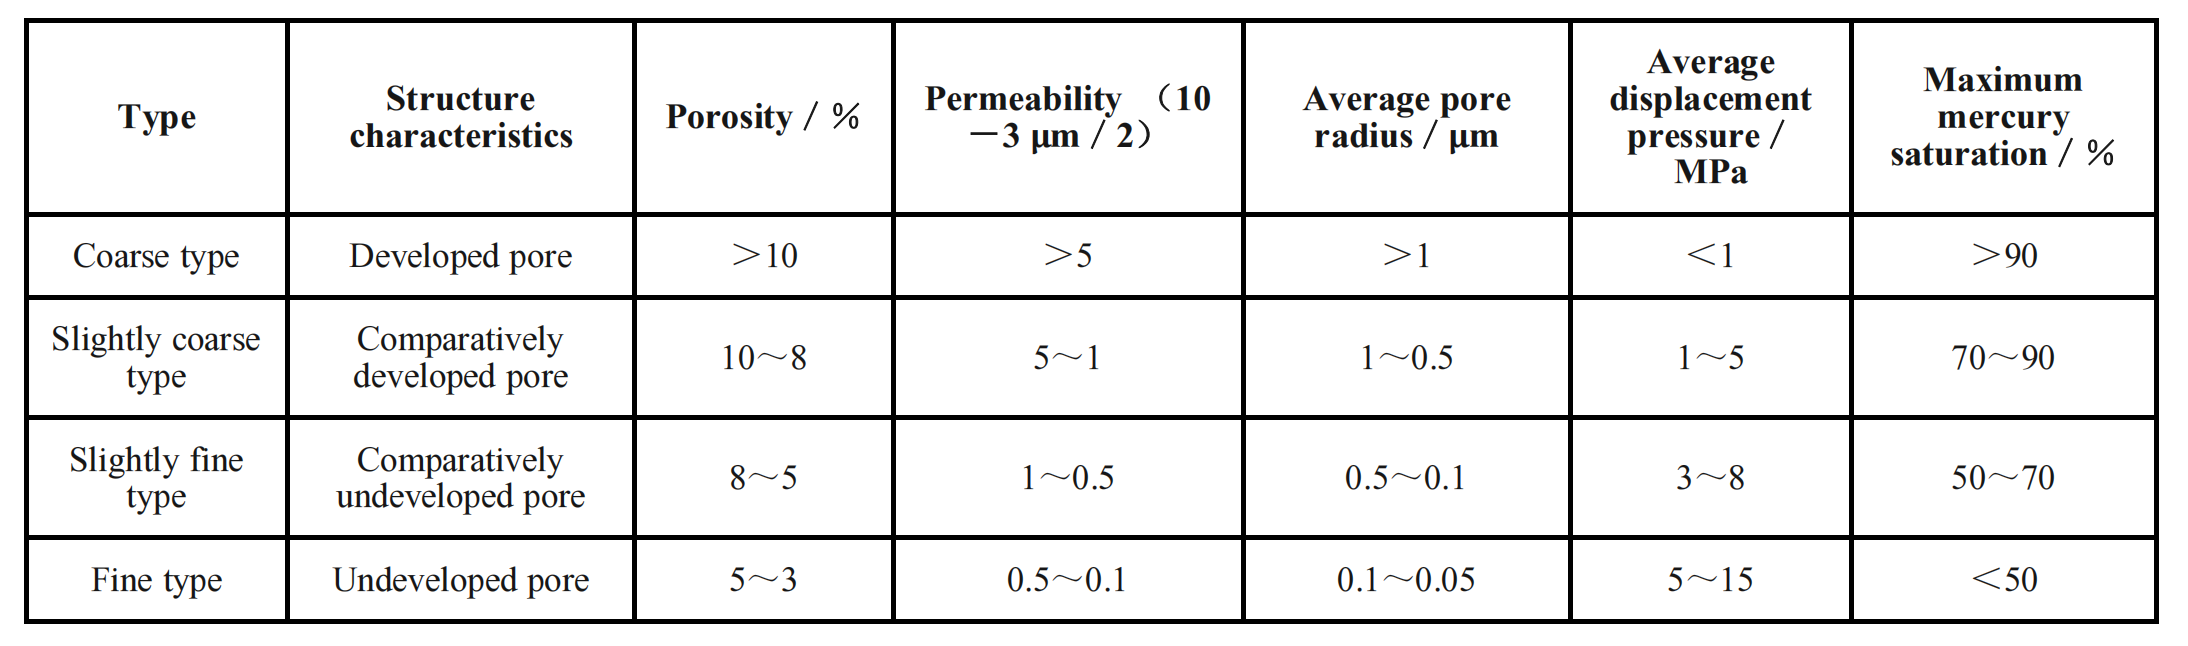
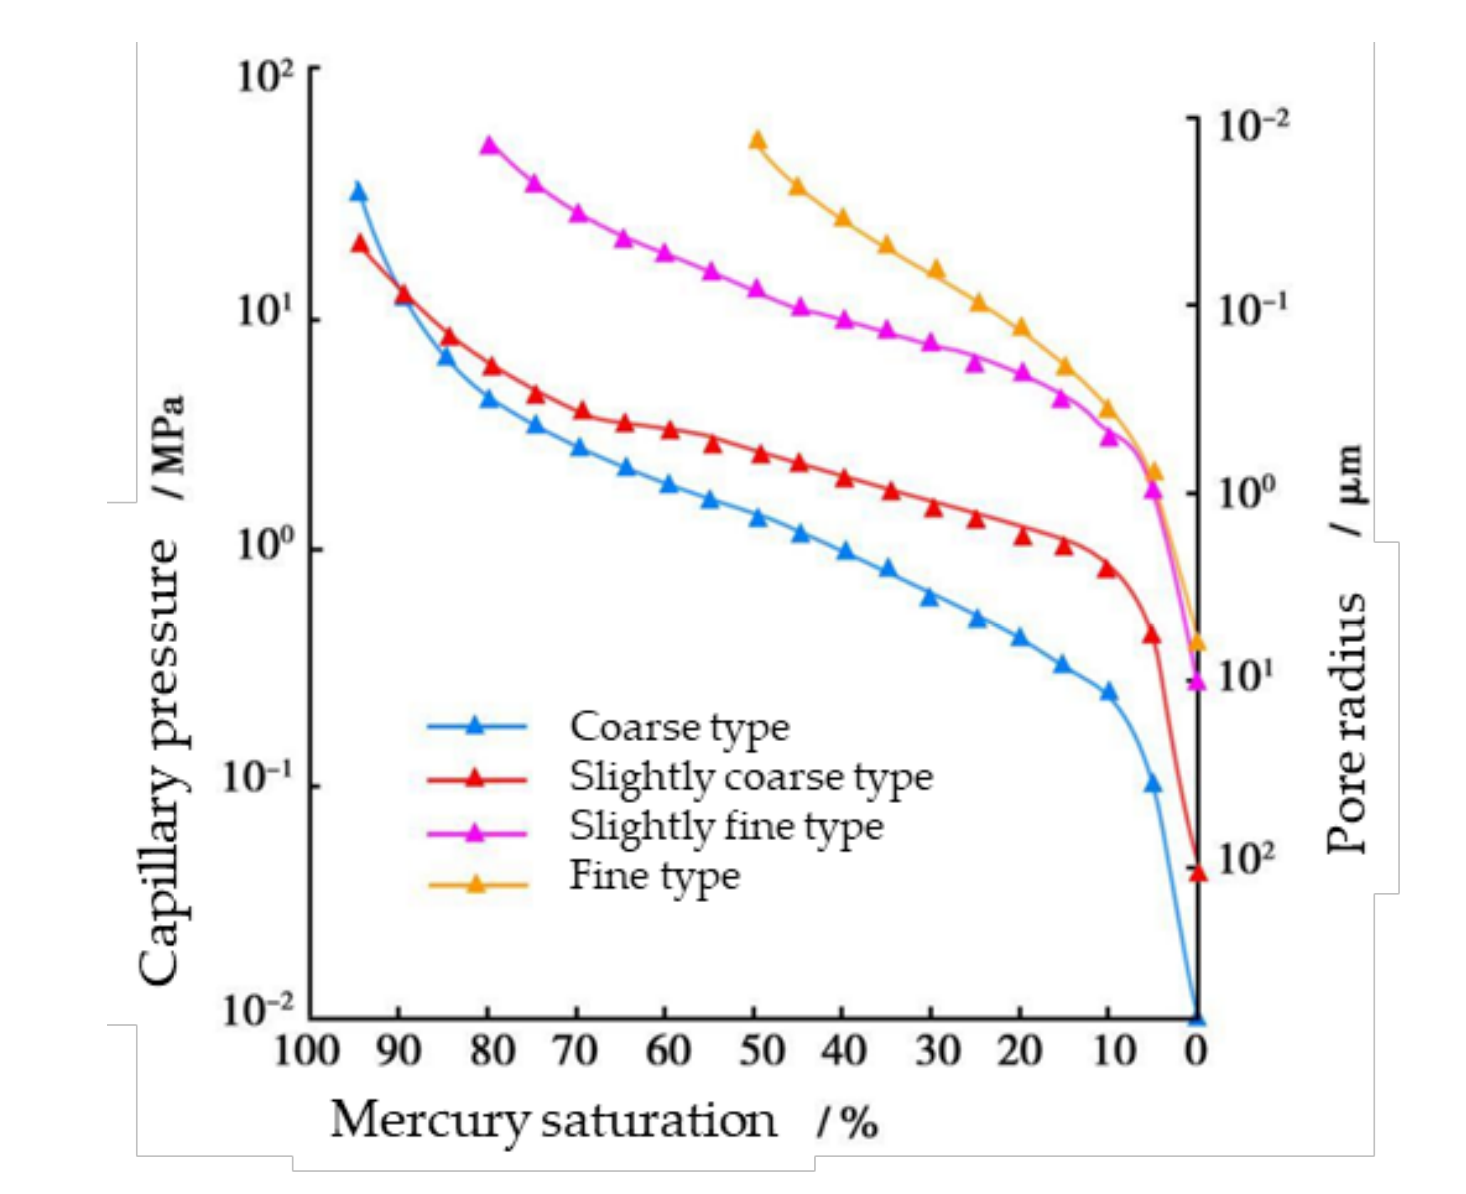
Generally, the pore structure of volcanic rock material can be divided into four types: coarse pore, slightly coarse pore, slightly fine pore and fine pore. According to the analysis and research of the data of these material samples, the curve shape of their capillary pressure and various characteristic parameters were statistically analyzed [31], and their classification was as follows (Figure 16):
- General morphology of the capillary pressure curve demonstrates the type of coarse pore structure. When the average displacement pressure is less than 1 MPa, the median mercury saturation pressure is low, the maximum mercury saturation value is greater than 90%, and the average pore radius is greater than 1 μm.
- The capillary pressure curves of the micro-coarse pore structure are as follows: the average displacement pressure is 1-5 Mpa, the median mercury saturation pressure is low, the maximum mercury saturation is 70-90%, and the average pore radius is 0.5 ~ 1 μm.
- The capillary pressure curve of the micro-pore structure shows that the average displacement pressure is 3 ~ 8 Mpa, the median mercury saturation value is high, the maximum mercury saturation value is 50 ~ 70%, the average pore radius is 0.1 ~ 0.5 μm, and the curvature is small.
- The capillary pressure curve of the fine pore structure is shown as follows: the average displacement pressure is 5 ~ 15 Mpa, the maximum mercury saturation value is less than 50%, the average pore radius is 0.05 ~ 0.1 μm, and the bending is good.
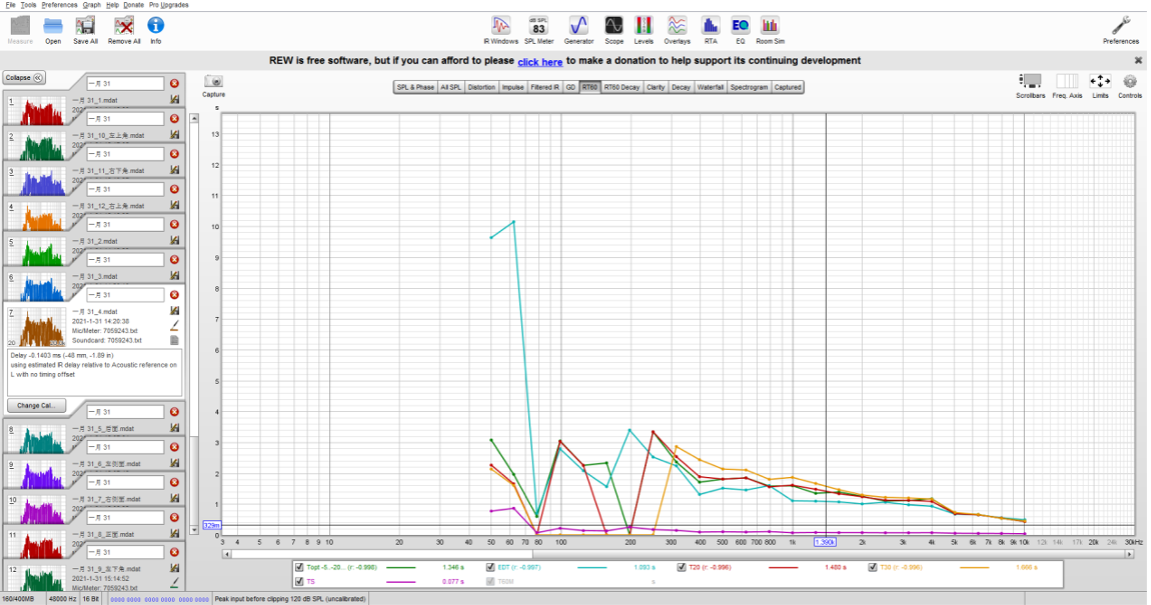
Method 2: This study uses the SUPERLUX ECM999 to open the REW acoustic measurement software through a computer connection, and the electric sound installed in the software is used for testing. Finally, the obtained median, left, right, and post vocalisation value are used to obtain the mean RT value of the four data points. Figure 4 shows the measured spatial position and direction, and Figure 5-8 show the data values measured by REW acoustic measurement software in each direction.
- Definition of volcanic rock on the wall D50.
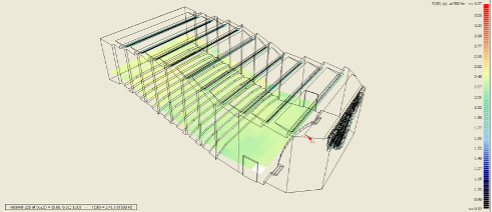
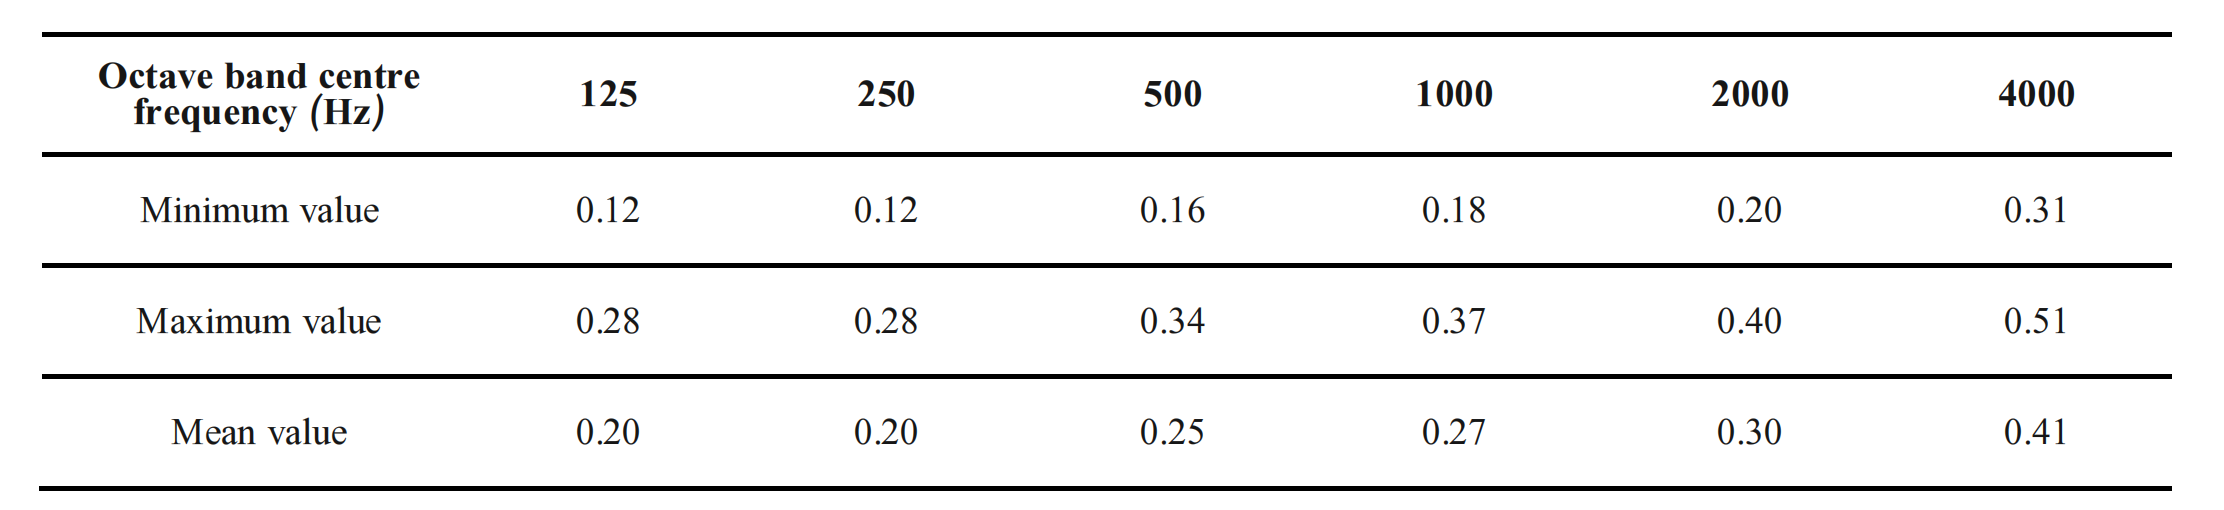
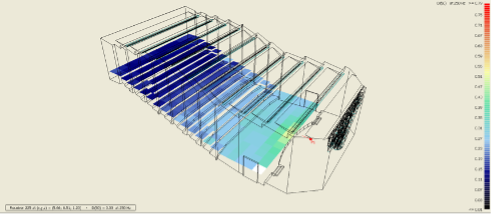
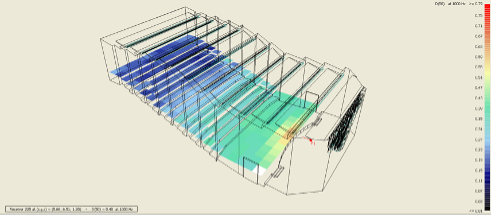
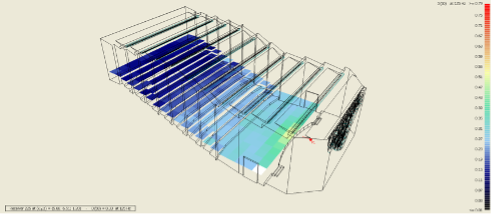
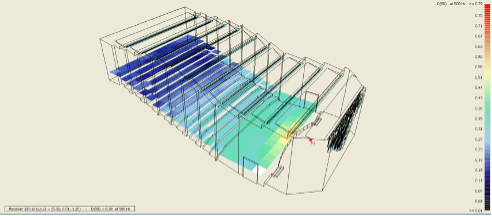
Definition D50 distribution diagram of six octaves ranging between 125 Hz and 4000 Hz of the volcanic rock on the wall (Figure 36-41).
First of all, according to the principle and structural characteristics of sound absorbing materials, the volcanic rock decorative surface materials on the market are selected. The size is set to 0.6m × 0.3m.
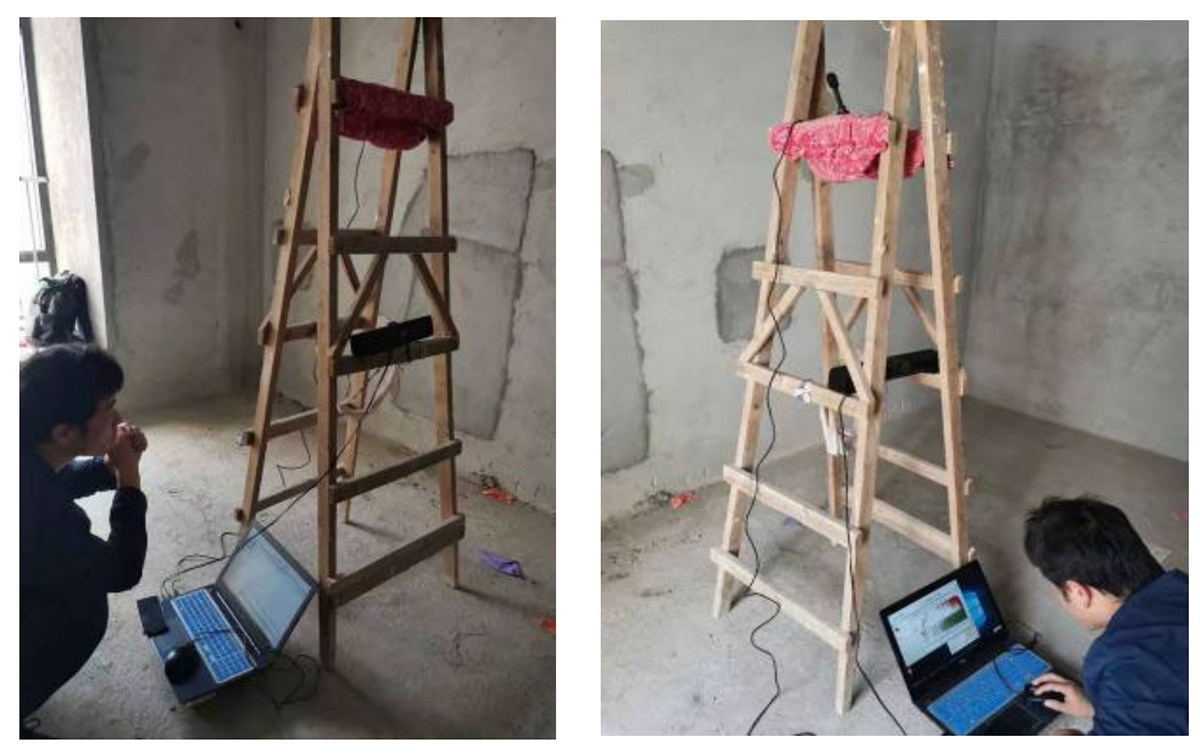
- In order to test the sound absorption coefficient, eleven 1.2m × 0.6m volcanic stone plates were assembled using a module of 0.6m × 0.3m, with a total area of 7.92 ㎡.
- The test environment was set with its environmental noise below 30 dB, rough-cast room was 4.4 m (L) × 2.9 m (W) × 2.7 m (H), and the total space volume was 34.45 m³.
- The sound classification of a balloon burst sound and electric sound was used in the test.
- The sound test tools are AudioTool measurement APP, REW acoustic measurement software, Smart AR854 and other high-precision professional sound test instruments.
- The sound tool was used to measure the RT of the roughcast wall in the classroom before and after the volcanic plate hanging, and the mean sound absorption coefficient and volume were calculated. By comparing the sound absorption coefficients before and after replacement, the possible sound absorption coefficients of volcanic plates are derived.
The last step is to use the obtained sound absorption coefficients of volcanic rocks and input them into the acoustic simulation software ODEON to simulate the possible sound environment in the teaching space.
(b) Left vocalisation
Analysis of Sound Simulation Effect of Volcanic Stone in Space of the Lecture Room
In the teaching environment of the school, in addition to the provision of regular classrooms, it is necessary to provide lecture halls with special teaching purposes and functions. Due to the large space volume of the lecture hall, and often the need to play audio and video, the requirements for space sound quality control are much higher than the general classrooms. Therefore, this study also included a sample test of the lecture hall and conducted a series of experiments on the sound quality control of the lecture hall, considering how volcanic rocks respond to the various needs of the lecture hall.
Basically, most lecture halls lack scientific consideration of indoor sound field design in their construction process. According to the statistical results, most teachers and students think that the sound quality of the rear part of the lecture hall with more than 150 people is usually poor. Therefore, most of them believe that places such as lecture halls should be acoustically treated to achieve a better sound field effect [32]. Chunyan [33] studied the RT range suitable for classrooms which are under the condition of natural sound teaching and found that the suitable RT range for small classrooms was 0.4-0.6s, while the suitable RT range for large classrooms was 0.8-1.0s. Chen [33] believed that the space volume and RT value of the lecture hall showed an increasing relationship when the space was not equipped with any loading of furniture and other facilities. The mean RT for empty spaces was 1.31 seconds, while the mean RT for full spaces was 1.12 seconds. According to China’s “Civil Building sound insulation design Code”, in the frequency range of 500-1000hz, if V > 300 m3, then the RT/ S ≤ 0.8 [32]. Along with the above literature, the RT value is the most important factor affecting the lecture hall, and it is also a vital parameter describing the indoor sound quality. Experiments have shown that prolonged reverberation can make people feel unclear about the sound, reduce the speech clarity, or even make the sound unable to be heard. However, RT being too short can make people feel “silent” and the sound will become unnatural.
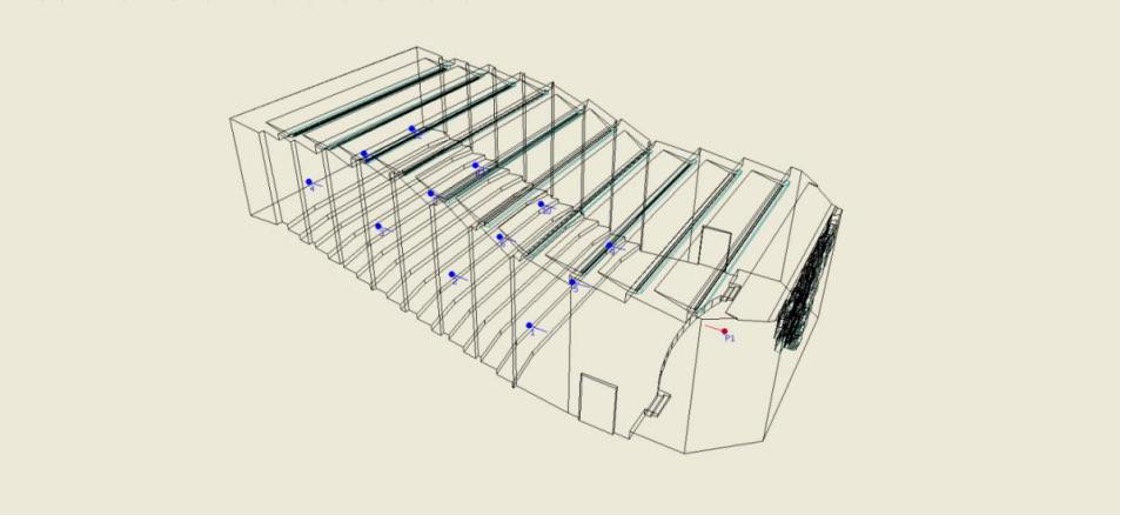
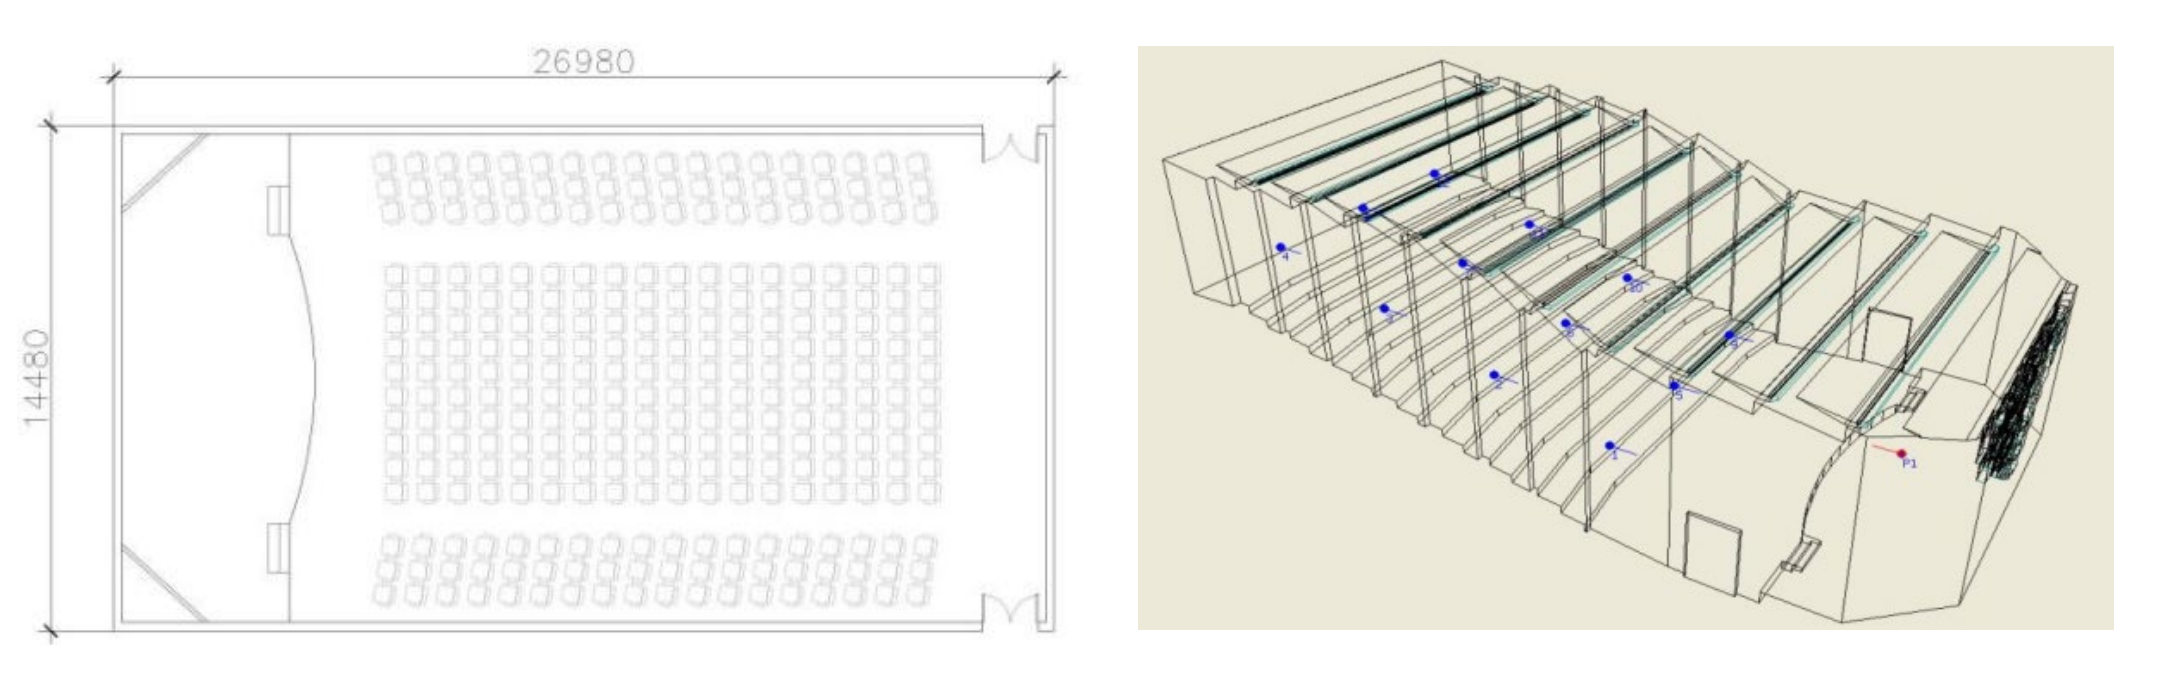
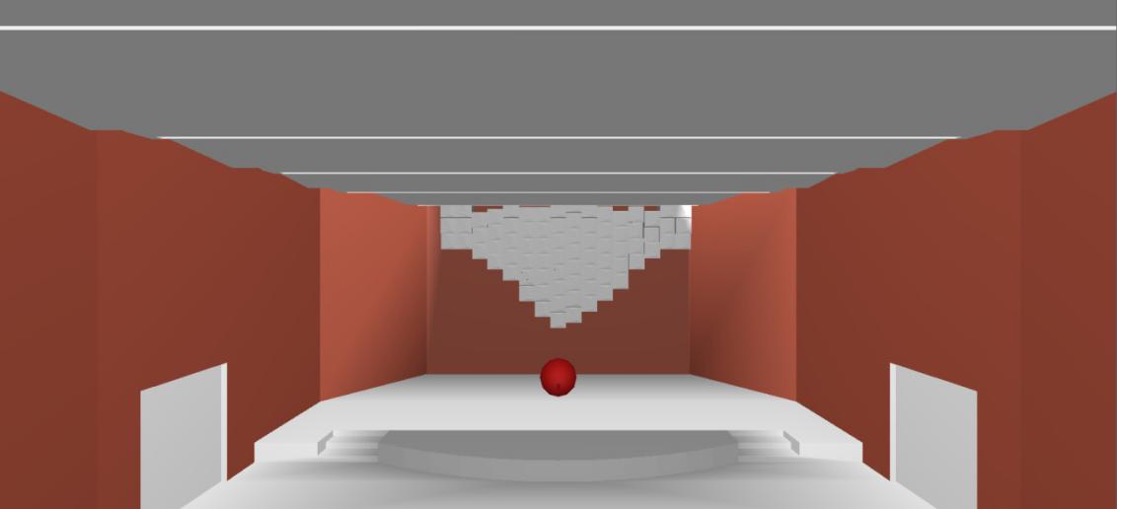
Normally, RT is proportional to the volume of the room and inversely proportional to the total sound absorption of the interior surface. The simulated lecture hall is a rectangular space, 26.98-m-long, 14.48-m-wide and 5-m-high, with a volume of 1953 m3 and an ascending staircase slope (Figure 17). The wall finishes are made of volcanic rock and the ceiling is a stepped wooden structure.
(c) Right data
Acoustic Quality of Volcanic Rock Material for Interior Space Control and Design: Evidence from Teaching Space
Introduction
In the system of educational institutions, according to the different learning stages, levels, needs and content provided, the educational objectives may be different, but the requirements for the teaching environment are basically the same. A good learning environment means that the environment formed by campus buildings has perfect overall characteristics and atmosphere, and the various facilities provided in the planning and design should be able to meet or exceed the needs of users in education, life, learning and other aspects. Generally, a good school environment has positive impacts on the teaching, learning, achievement, attitude, health, and behaviour of both teachers and students, showing great significance [1, 2, 3, 4, 5]. Kennedy (2002) believed that the quality of education provided by schools should be seen from the various facilities within them. For example, 10 design points that consider student learning spaces include natural lighting, sound, space, technology, ergonomics, maintenance, indoor air quality, safety, toilets, and roofs [6]. As a result, the school administration should pay special attention to these problems. Castaldi (1994) believes that the basic elements of educational facility planning should include adequacy, efficiency, economy, safety, health and comfort. In the management of schools, special awareness should be raised to the environmental composition of energy conservation, management, hearing, vision and other aspects [7]. Lackney (1999) studied environmental sound quality and came to the conclusion that environmental factors affect students’ physical and mental health. In addition, in a curriculum-based education system, environmental factors have a considerable impact on the effectiveness of learning. However, factors of design, configuration, and adjustment of teaching space, scale of facilities, and design of learning spaces, which are most frequently argued by the educators and the public, are often ignored [8].
School is an architectural entity with scientific and rational thinking orientation. For the physical environment of the school building, comfort and efficiency are two elements that receive great concern. Because students need to spend a lot of learning time in the classroom every day, the classroom lighting, color, noise, ventilation and other environmental elements will have a direct and indirect impact on the teacher’s teaching and students’ learning, as well as their physical and mental health. In the campus environment, the classroom is an integral part of the core function of the education building, and the comfort of the indoor acoustic environment will directly affect the learning and communication effect of teachers and students, and even the overall teaching quality. For architectural design, architects usually focus on reasonable functional layout and the composition of aesthetic decoration [9, 10] but seldom consider the comfort of indoor acoustic environment. Background noise is the most basic scene-noise factor in the indoor sound environment [11]. When the sound pressure level (SPL) of background noise is too high, it will affect the sound environment and the listener’s feeling. The research results show that the maximum allowable background noise level of the classroom is 50 dBA, which is also the main reference of China’s national standard [12, 13].
Huan classified the specific noise [14, 15] and listed 11 common noise sources such as traffic noise, activity noise and communication noise. In addition, reverberation time (RT) has a significant impact on the indoor sound environment of teaching spaces [16]. Yongmin et al. found the best RT for designing the classroom sound environment through experiments. Their experimental method was to evaluate the acoustic environment by adjusting the RT to obtain the average speech intelligibility. According to their experimental results, when the classroom volume is less than 200 m³ and the signal-to-noise ratio is not less than 20 dB, the reference recommendation value of the optimal design RT is 0.6s [17]. Jie et al. conducted RT measurements in ordinary classrooms of 28 universities and primary and secondary schools in China. The measured result is more than 1 s, so it fails to reach the recommended value of the standard. In other words, if the RT in the classroom is greater than 1 s, the value of speech intelligibility will be above 0.6. Based on this result, Chunyan proposed that in a small ordinary teaching space, if the background noise in the noise evaluation curve is less than 35, then the RT will be between 0.4-0.6 s. At the same time, in larger classrooms with larger indoor background noise, RT should be between 0.8 and 1.0 s [18, 19]. Nebalek and Robinson found through research that the technique and composition of interior decoration will also bring certain changes to the indoor sound environment, such as changing the way of sound diffusion in space. This approach can be understood as adding acoustic or reflective materials to the indoor environment. Therefore, they believe that when analyzing the indoor sound environment, the form and material of furniture should also be considered. These research results show that with the increase of indoor RT value, the score of indoor speech intelligibility will continue to decline [20, 21].
Alternatively, the sound quality of the interior space is closely related to the wall. When discussing the application of architectural acoustics in architectural decoration, You Tiangang (2022) pointed out that the upper wall of the auditorium should be able to accommodate a large proportion of various sound absorbers. These variable absorbing elements can be mechanically managed and operated by either an acoustic screen or an active panel. This variable absorber design is widely used in modern acoustics, and most concert halls apply it on the rear wall [22]. On the basis of optimizing the design of the existing reverberation chamber, Liang Xinjian and Zhou Hongmei (2021) also pointed out that the transformation of the internal wall can provide references for detecting the sound absorption coefficient and noise reduction effect of different sound absorbing materials [23]. Xie Dong (2023), on the other hand, believes that the air sound insulation performance of walls has a key impact on the comfort of indoor sound environment. Therefore, how to optimize the sound insulation performance of commonly used wall structures is an important task in the design of indoor sound environment. According to the characteristics of the wall structure and the noise frequency band, the weight apparent sound insulation of the wall can be significantly improved after sound absorption material is added [24]. It can be seen that the wall treatment will optimize the acoustic environment of the indoor space to a certain extent.
The main purpose of this study is to apply volcanic rock materials to the acoustic absorption experiment of teaching and learning spaces. The simulation software for measuring sound absorption is used as a tool to explore the possibility of sound control by applying this material as an indoor wall material. The preliminary results show that volcanic materials can achieve specific acoustic control effects through different spatial functions. In particular, if the required sound absorption effect can be achieved in the educational space, it will be able to improve the quality of the acoustic environment of teachers and students.
In this study, volcanic rock materials were tested in the teaching space by means of software simulation. The final results show that volcanic rock materials have good sound absorption performance, and the sound absorption coefficient is close to that of common sound absorption materials. Therefore, it is feasible to use volcanic rock material as an indoor wall material for sound control and it is necessary to further study the sound absorption performance of volcanic rock material under different conditions and its application in different spaces. At the same time, the durability and cost of volcanic rock material in its practical application needs to be considered, to ensure that it can be widely used in building construction.
Abstract
The cognition of a good campus environment refers to the physical environment formed by planning and design, considering the function, reasonable layout and atmosphere of the space, and putting forward an implementation plan that can meet or exceed the teaching, learning and life needs of teachers and students, so that the campus has perfect overall characteristics. This paper takes university lecture halls as the research object, studies the spatial sound requirements and tests the acoustic quality control of these spaces, and attempts to explore the feasibility of using volcanic rocks as wall decoration materials. According to the characteristics and principles of sound transmission, combined with the present situation of the lecture hall and its original acoustic environment, a series of acoustic field experiments are implemented. By means of computer software simulation, the advantages of volcanic rock as wall decoration material in sound absorption effect and quality control are proved, and also its effect is better than other materials. Obviously, the computer simulation software is an applicable way in assisting the selection of interior wall decorative materials. Therefore, this study confirms the sound quality characteristics of volcanic rock materials and provides a feasible reference for those spaces requiring acoustic quality control in the future.
(a) Median vocalisation
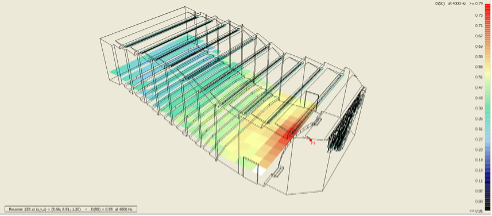
STIPA of the acoustic amplification system of the wall volcanic rock was obtained. The speech definition was indicated by a single numerical value between 0 (bad) and 1 (good).
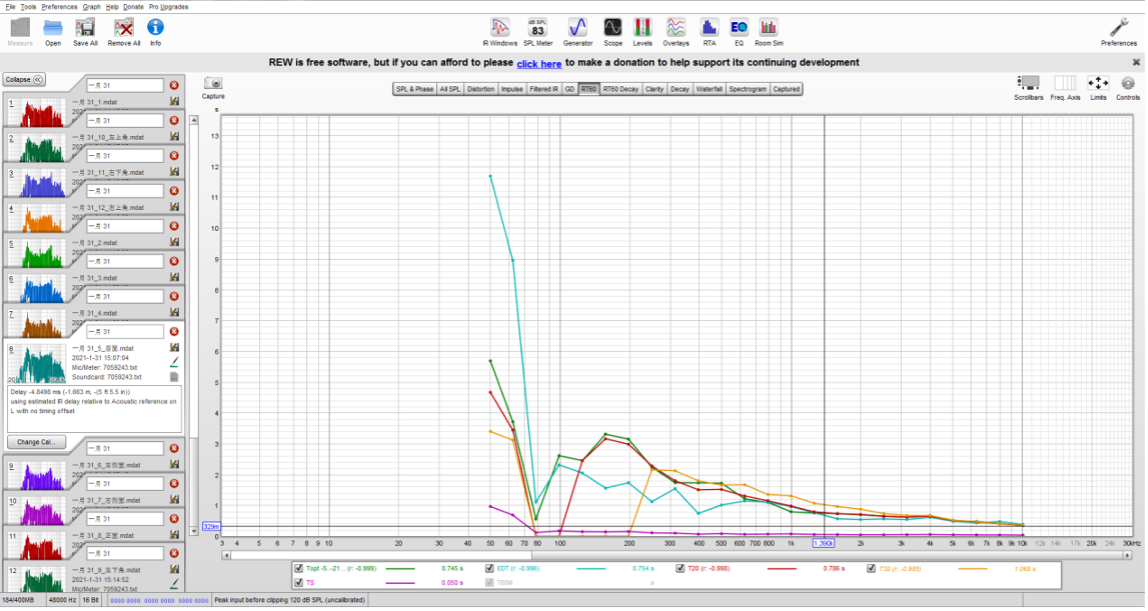
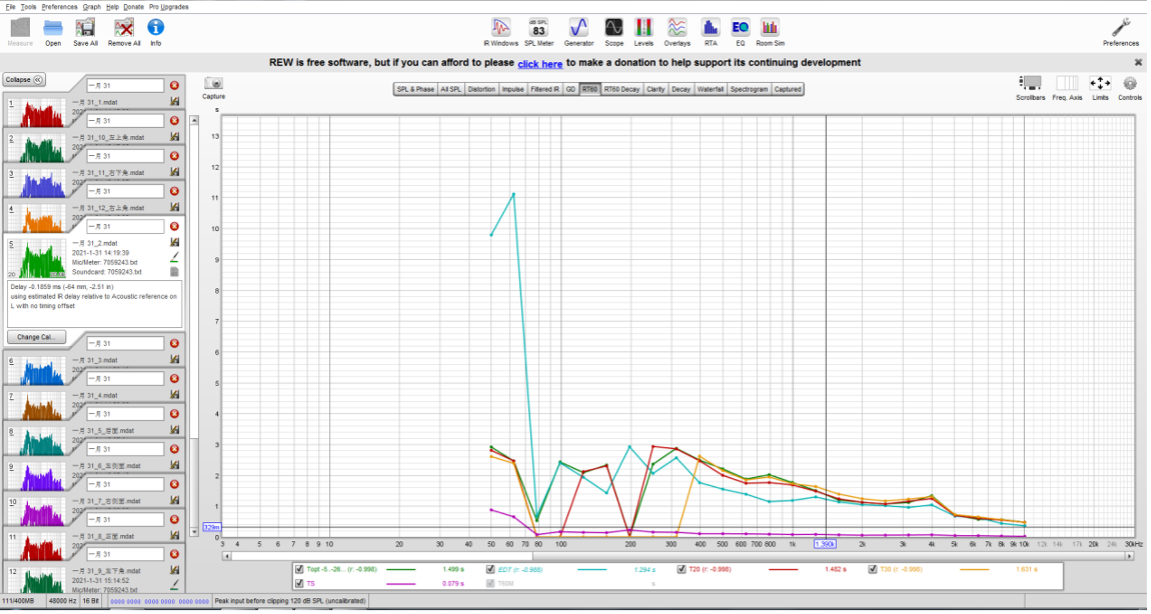
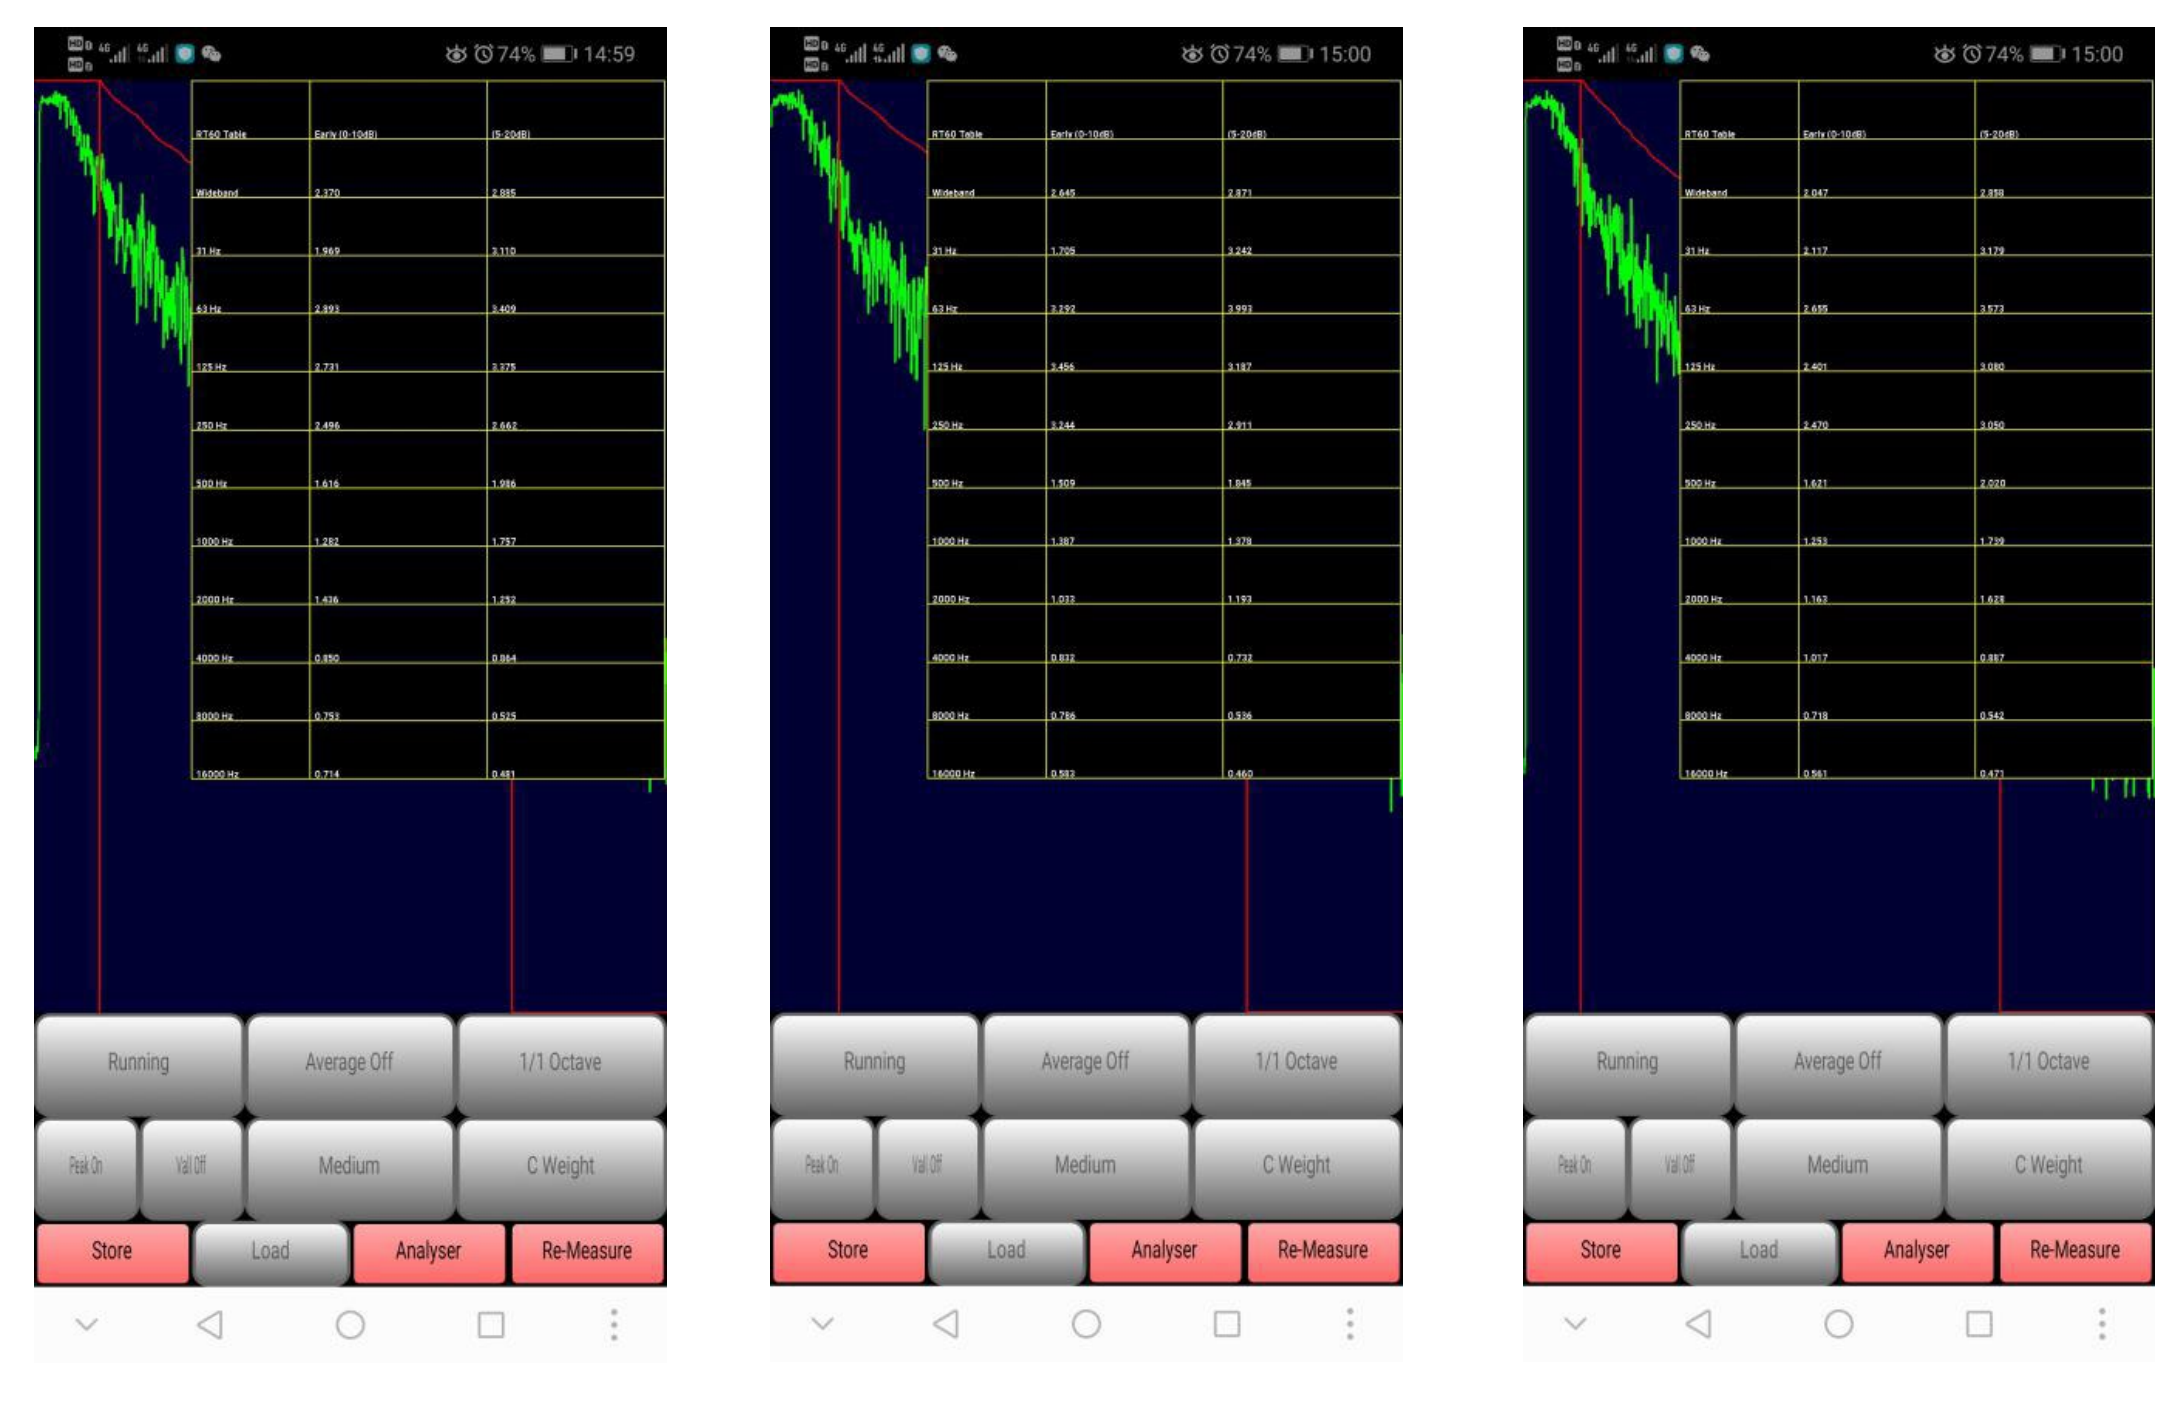
Table of Contents
- Abstract
- Introduction
- Materials and Methods
- Results and Discussion
- Conclusions
- Author Contributions
- Funding
- Data Availability Statement:
- Acknowledgments
- Supplementary Materials
- Conflicts of Interest
- References
Wei Zhang 1 ,
by
1 Faculty of Humanities and Arts, Macau University of Science and Technology, Macao, China
2 School of Design, Fujian University of Technology, Fujian, China
* Author to whom correspondence should be addressed.
JDSSI. 2023, 1(3-4), 56-83; https://doi.org/10.59528/ms.jdssi2023.1231a13
Received: October 25, 2023 | Accepted: December 24, 2023 | Published: December 31, 2023
(a) Left data
(b) Mid data
(c) Right data
Author Contributions
Conceptualization, W. Zhang, X.Z. Zhang and K.H. Wen; methodology, W. Zhang, X.Z. Zhang, and K.H. Wen; software, W. Zhang; validation, W. Zhang, X.Z. Zhang and K.H. Wen; formal analysis, W. Zhang; investigation, W. Zhang; resources, W. Zhang; data curation, X.Z. Zhang and K.H. Wen; writing—original draft preparation, W. Zhang, X.Z. Zhang; writing—review and editing, X.Z. Zhang and K.H. Wen.; visualization, W. Zhang; supervision, X.Z. Zhang and K.H. Wen; project administration, X.Z. Zhang; funding acquisition, X.Z. Zhang. All authors have read and agreed to the published version of the manuscript.
Funding
This research was funded by the science and technology development fund of the Macao Special Administrative Region, grant number 0055/2021/A.
Data Availability Statement
Not applicable.
Acknowledgments
The experimental materials were provided by Xuwen County Wutai Stone Factory, Guangdong, China.
Supplementary Materials
Not applicable.
Conflicts of Interest
The authors declare no conflict of interest.
(c) Pre-transformation test - right
(a) Pre-transformation test - left
(c) Pre-transformation test - right
(b) Pre-transformation test - mid
(b) Pre-transformation test - mid
(a) Pre-transformation test - left
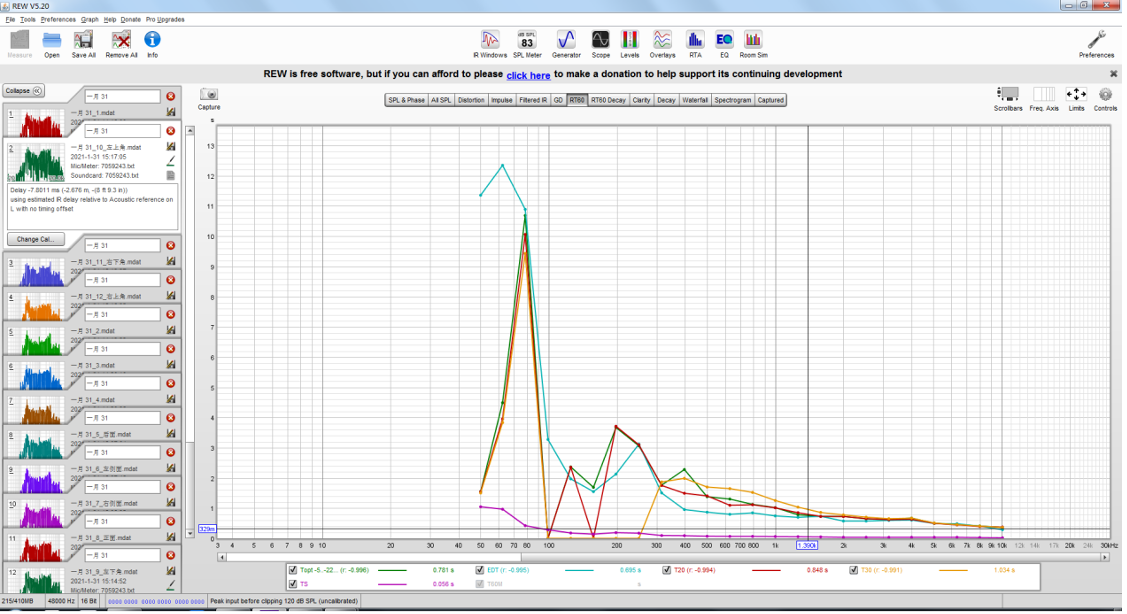
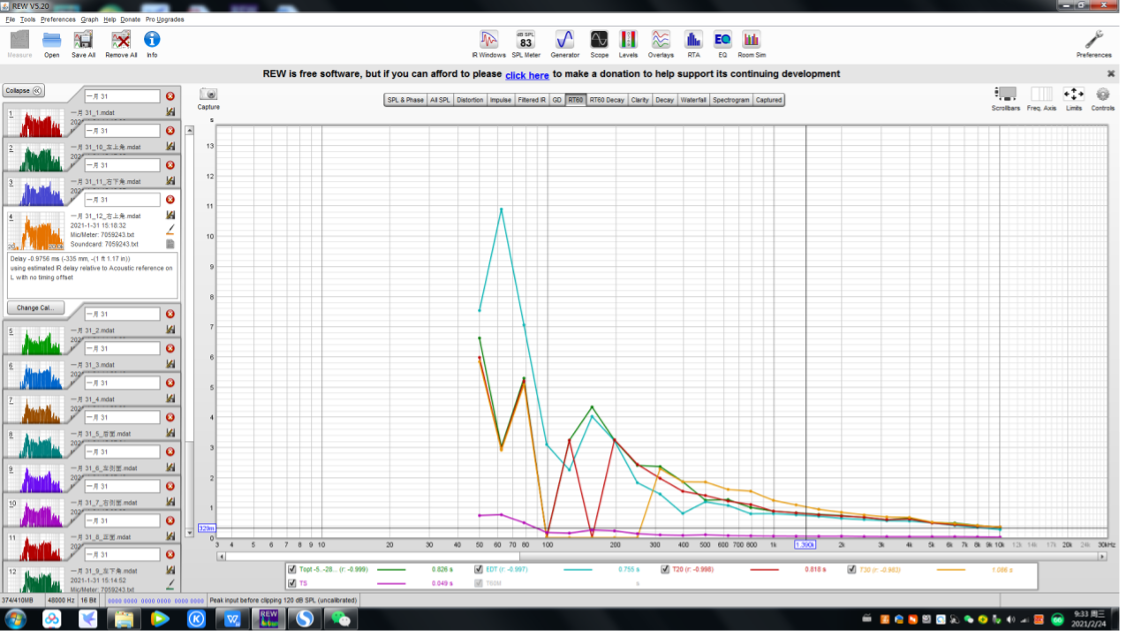
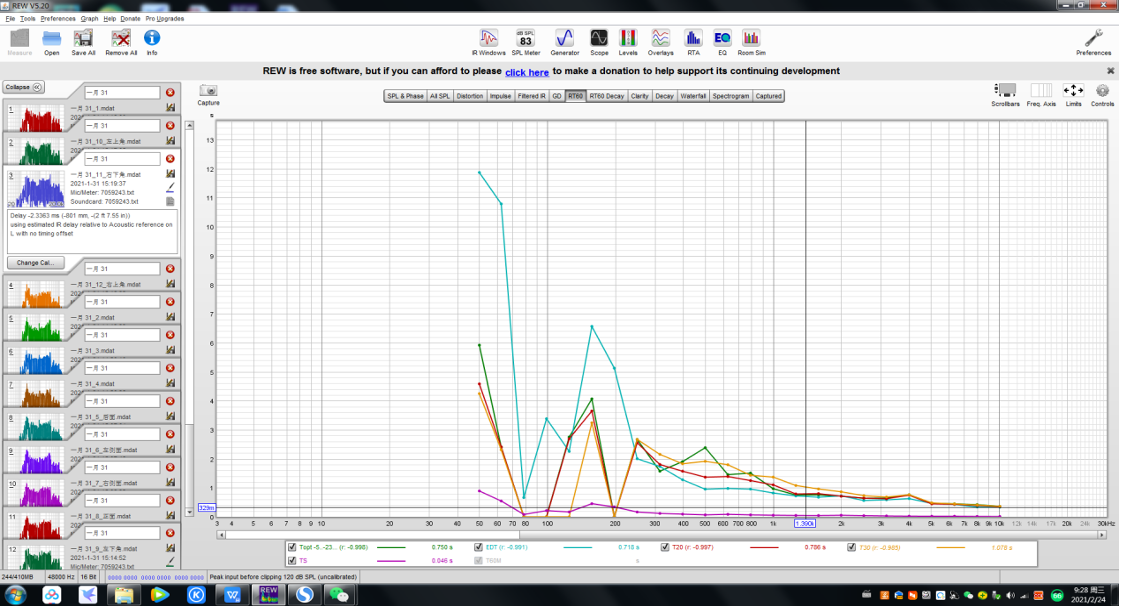
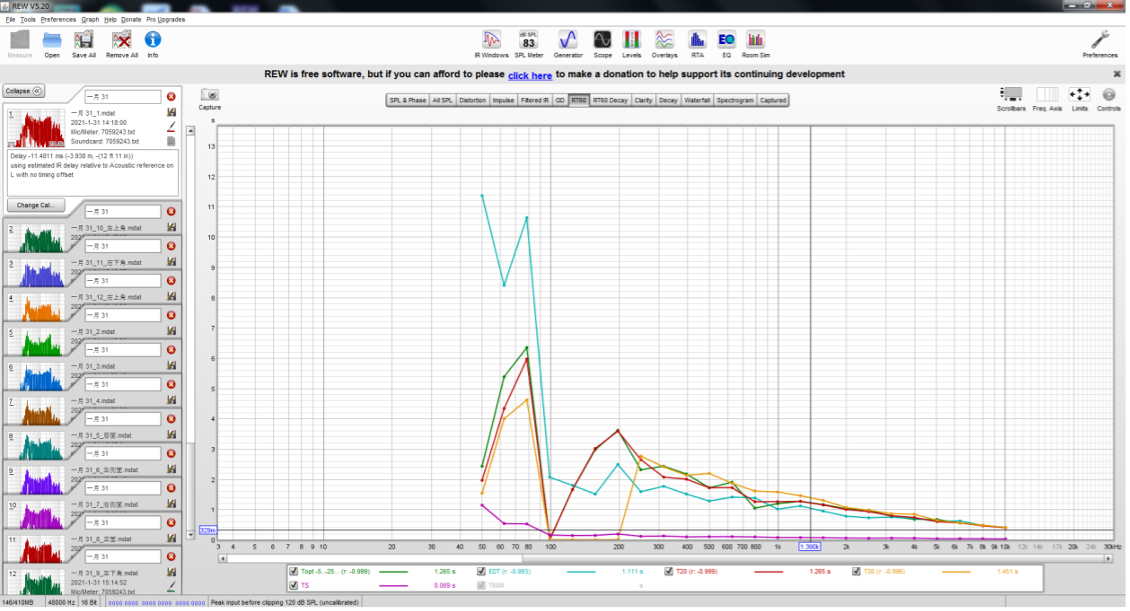
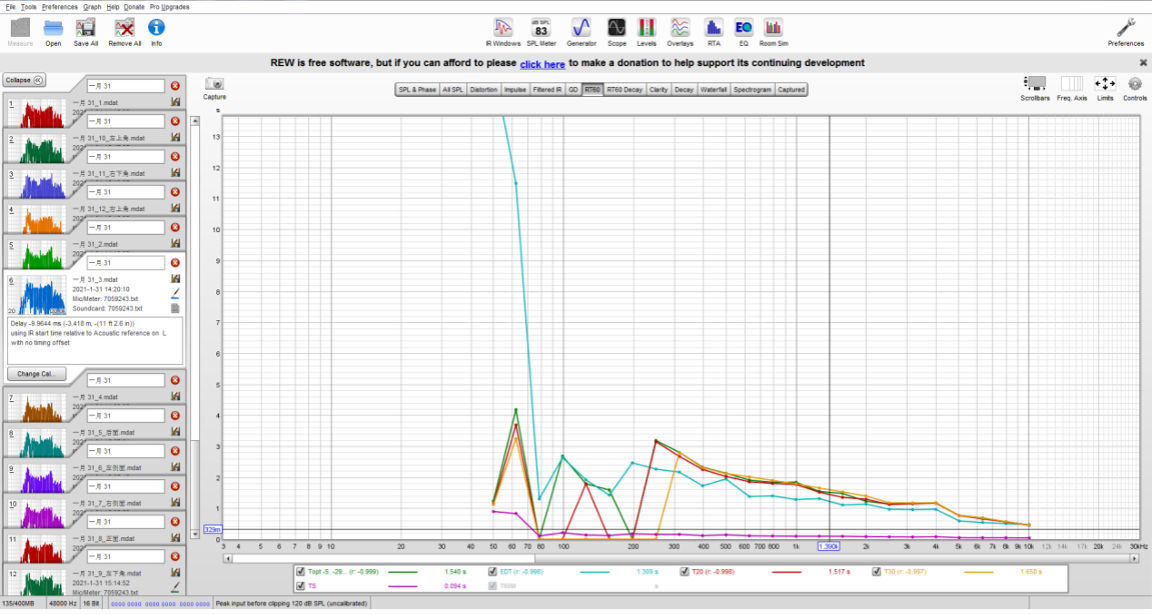
Method 2: The SUPERLUX ECM999 is connected via a computer, and the REW acoustic measurement software is turned on to test the electric sounds installed in the software. Finally, the median, left, right, and post value are used to obtain the mean RT value of the four points. Figure 11-14 shows the measured data values of the REW acoustic measurement software at the set positions in each direction.
Experiment Data
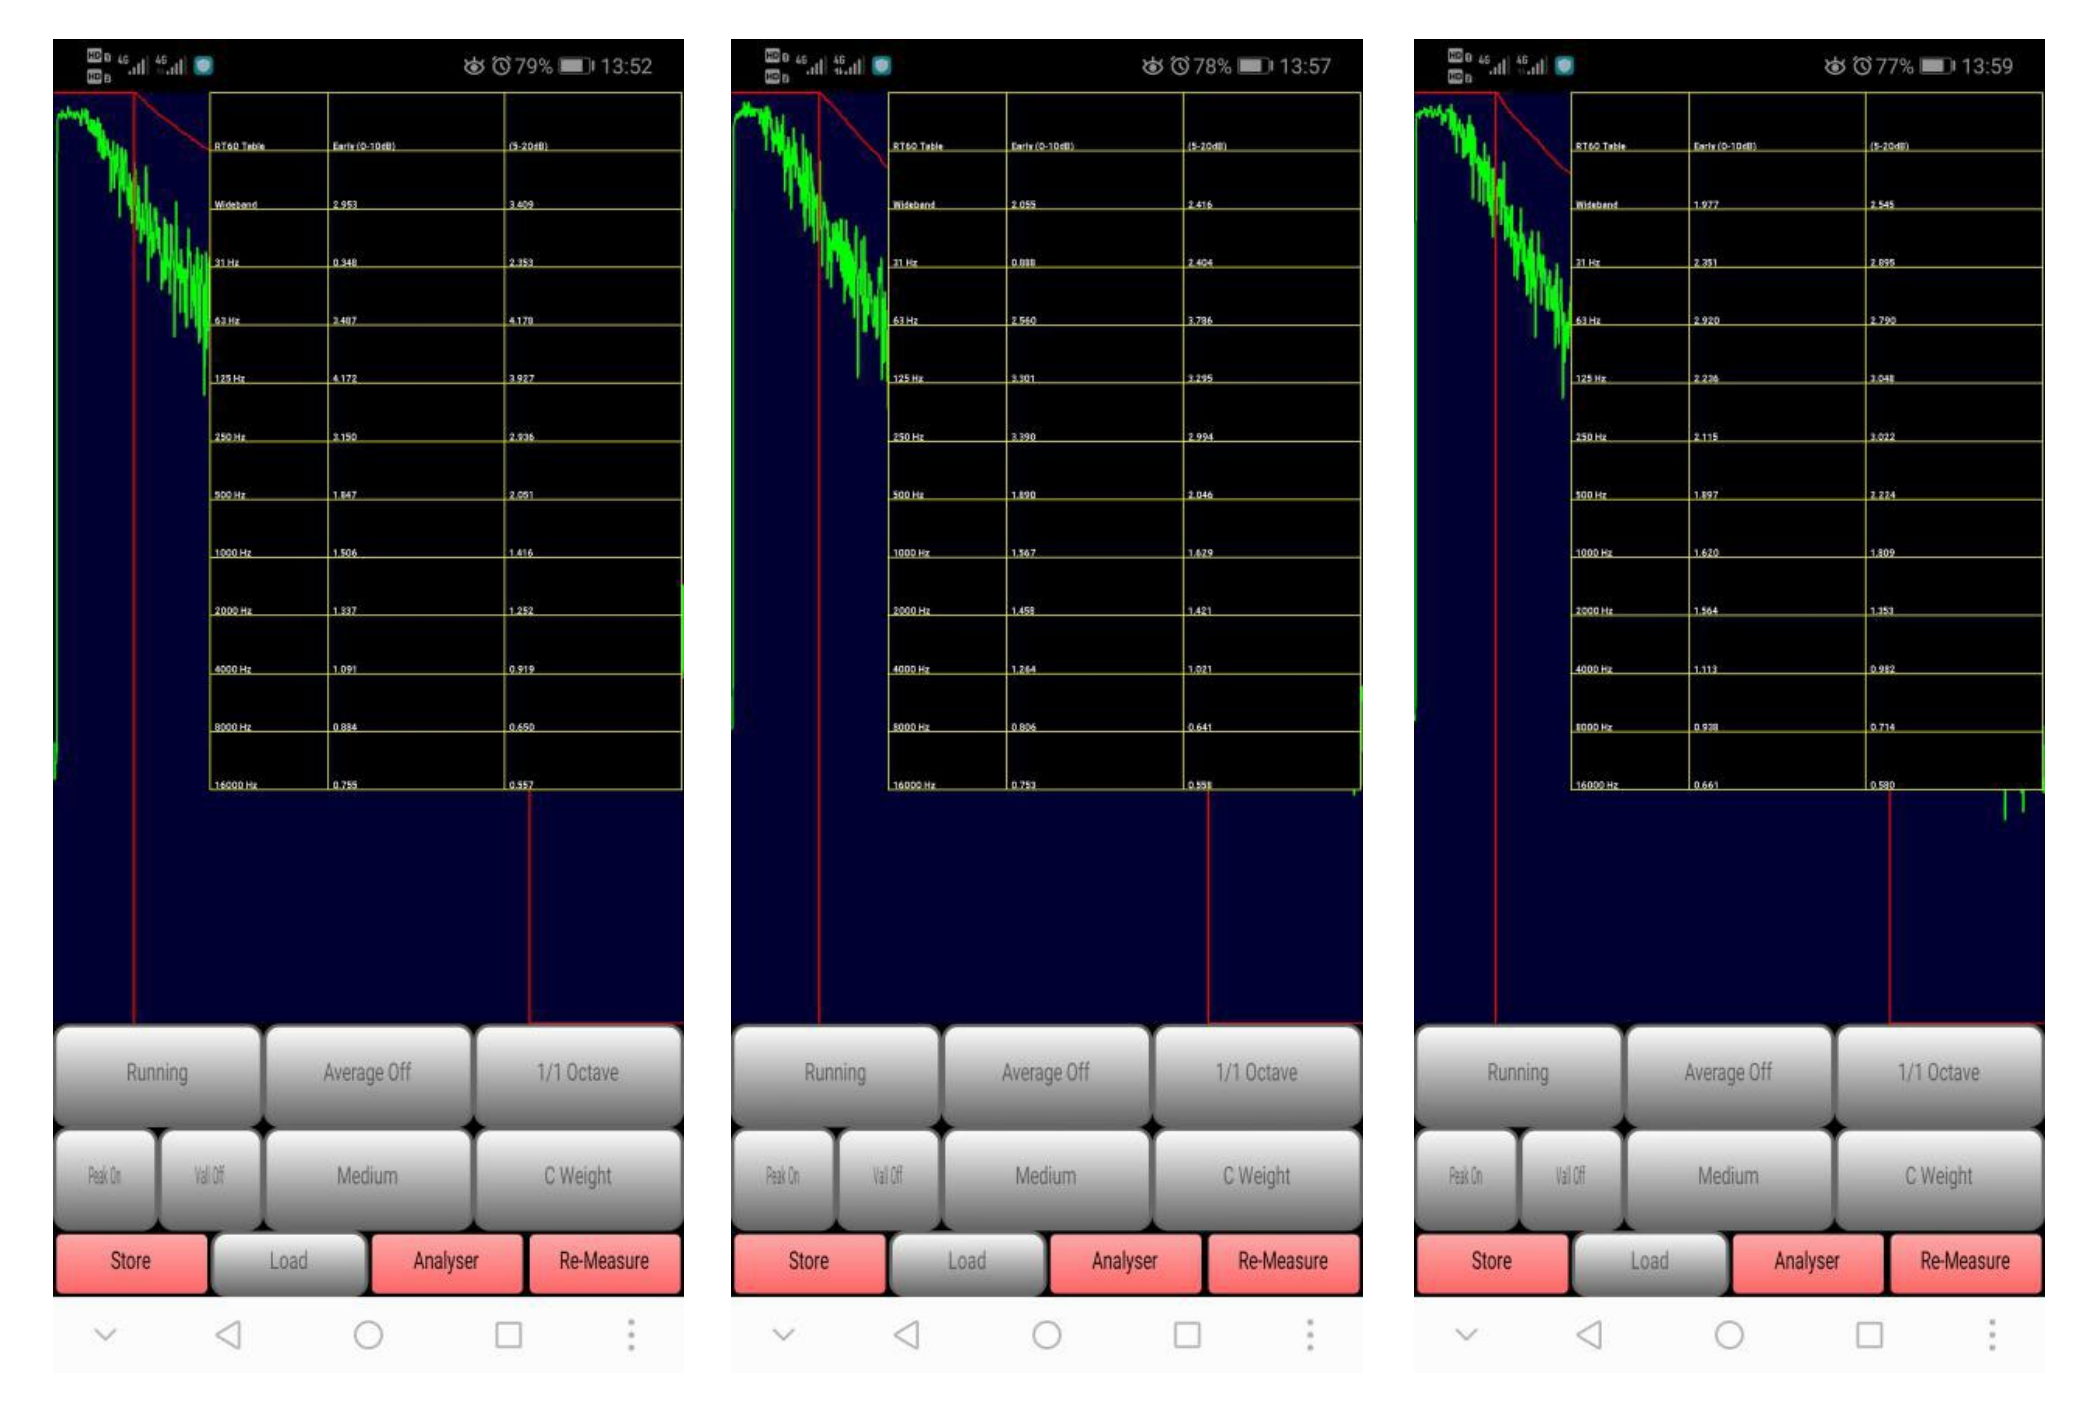
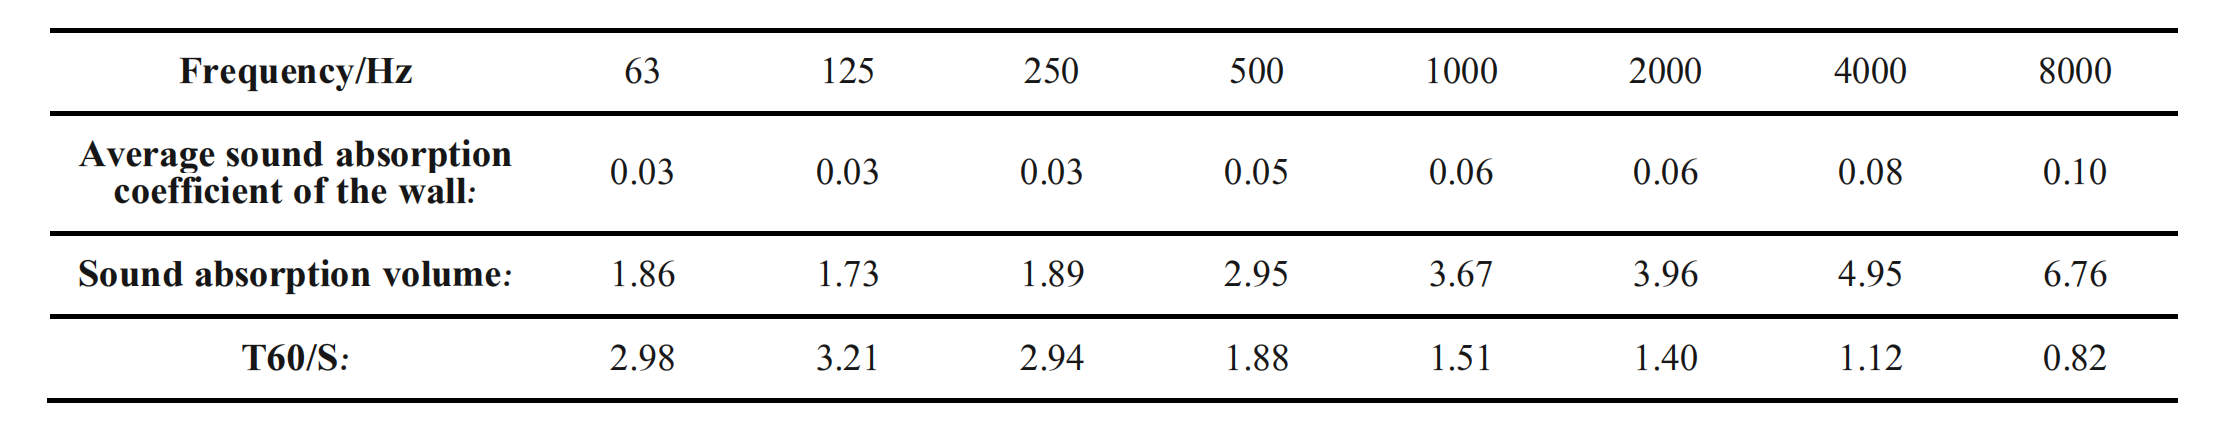
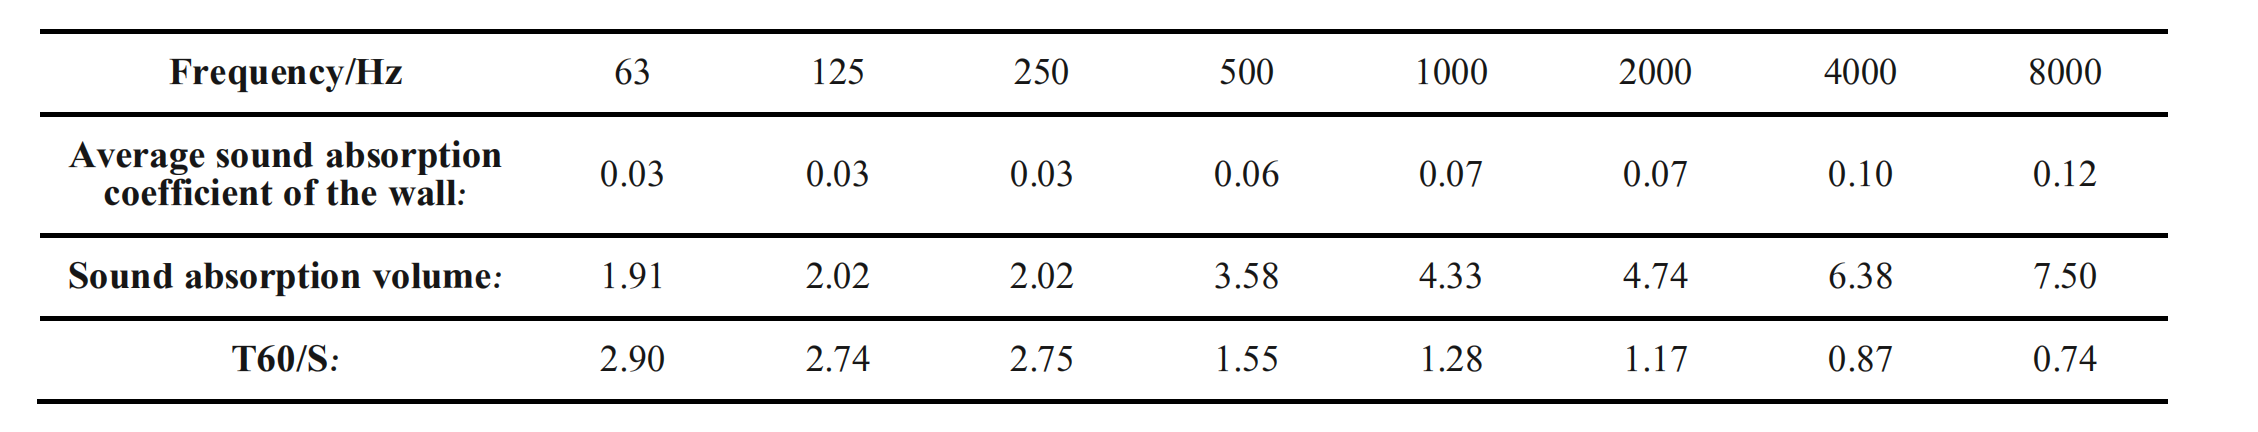
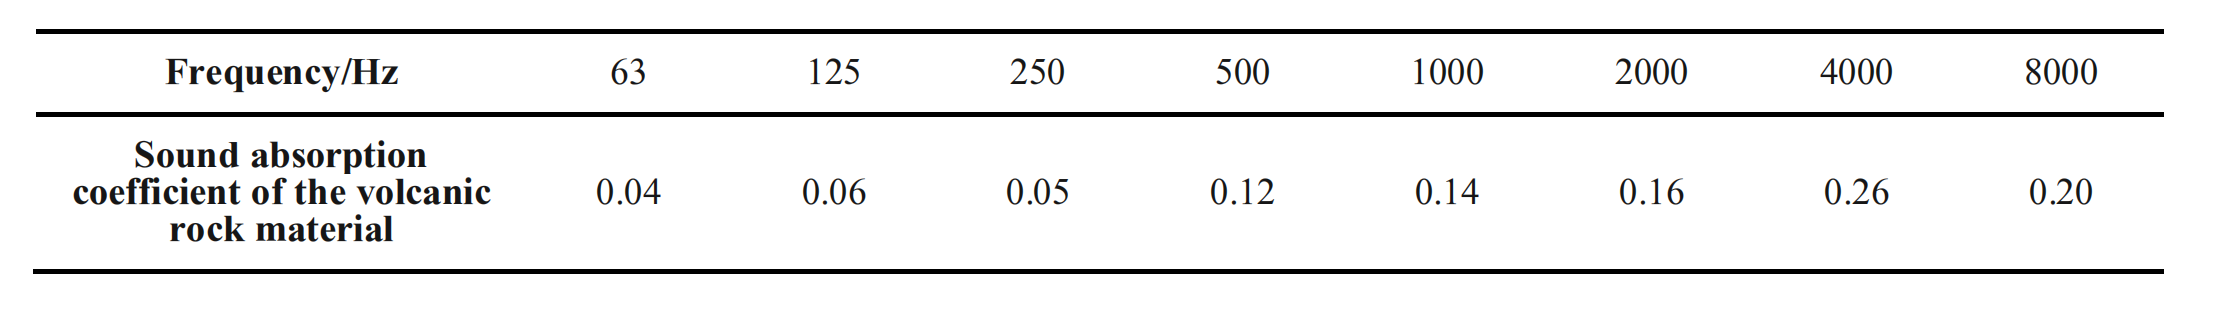
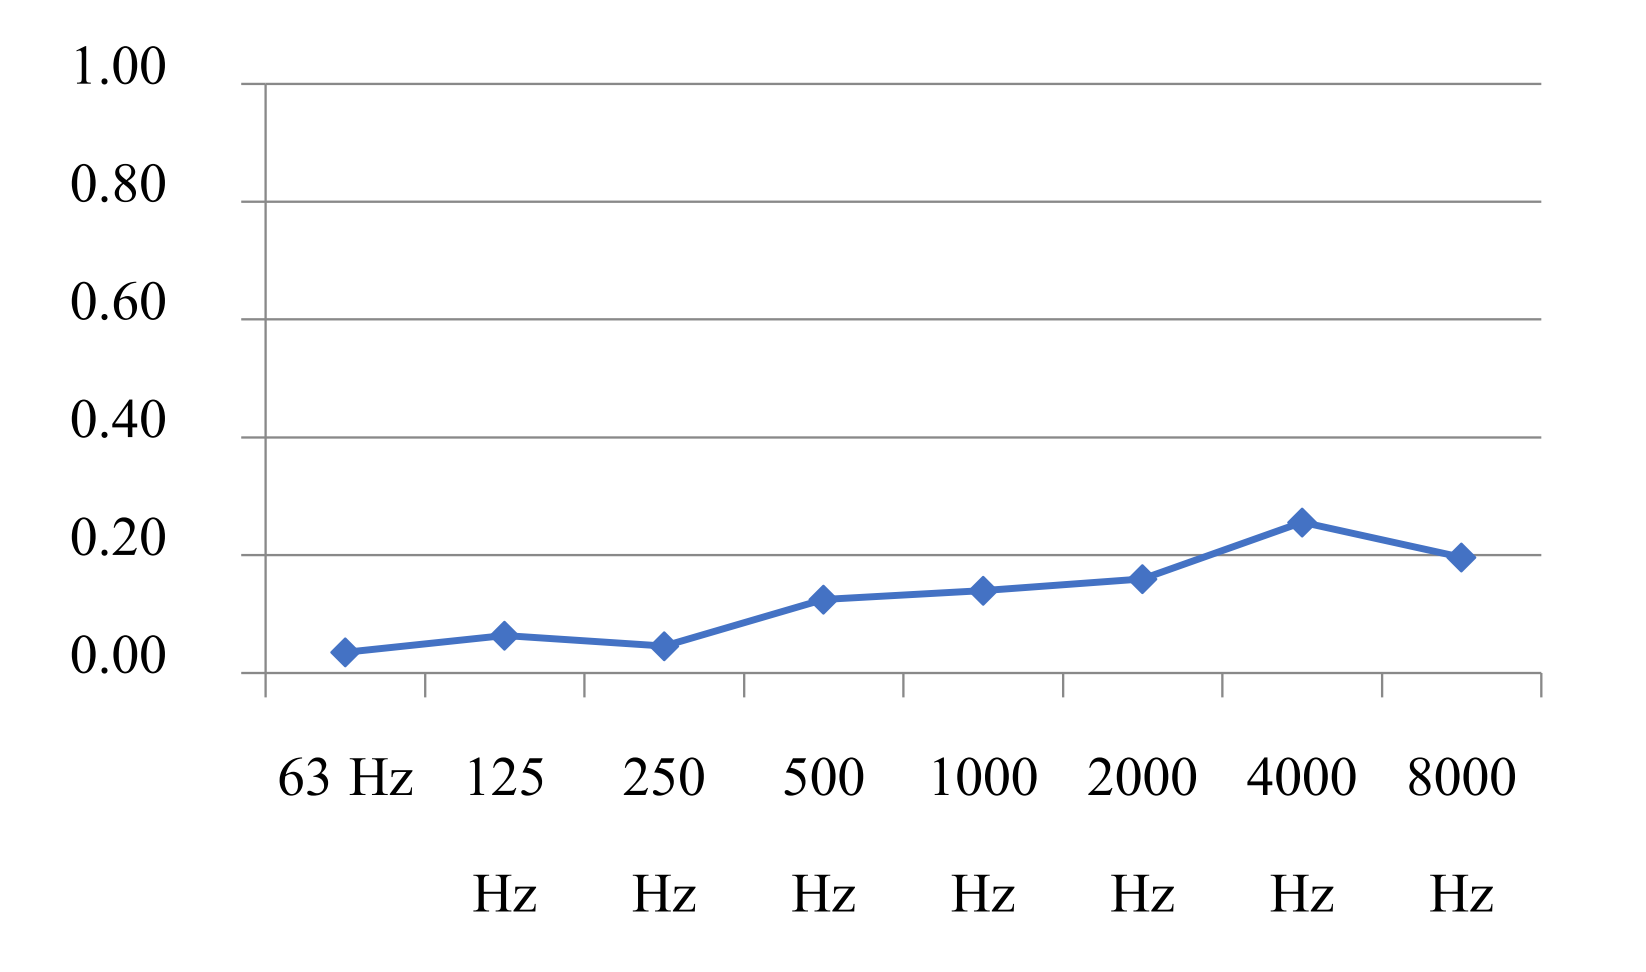
The acoustic experiments in this study were all conducted in the same space. Before the acoustic transformation, the actual measured values of T60 in the range of 500 ~ 1000 Hz are 1.88s and 1.51s, respectively. The sound absorption volume of the tested object is calculated by Serbin formula to be 2.95 and 3.67 respectively. After that, the acoustic absorption coefficients of the wall before the test transformation are 0.05 and 0.06, respectively. Through the change of the absorption coefficient, it can be seen that the absorption ability of the original wall is relatively weak. The T60 values measured in the range of 500 ~ 1000 Hz are 1.55s and 1.28s respectively after the wall is transformed in the way of hanging according to the acoustic wave module. After calculation by Serbin formula, the obtained sound absorption volume is 3.58 and 4.33 respectively, and the sound absorption coefficient values of the transformed wall are 0.06 and 0.07 respectively. In the range of 500 ~ 1000 Hz, the sound absorption coefficient and inversion test of volcanic rocks are 0.12 and 0.14, respectively, indicating a certain sound absorption ability. However, tests in conventional frequency bands showed poor, average and good sound absorption at low (63-125 Hz), medium (250-2000 Hz) and high (4000-8000 Hz) bands, respectively (Figure 15).
Tests After Transformation
Tools: Balloon, AudioTool, REW acoustic measurement software, SUPERLUX ECM999, SSONY Ericsson A6 computer MAGNETICALLY SHIELDED, and Dell i5 laptop.
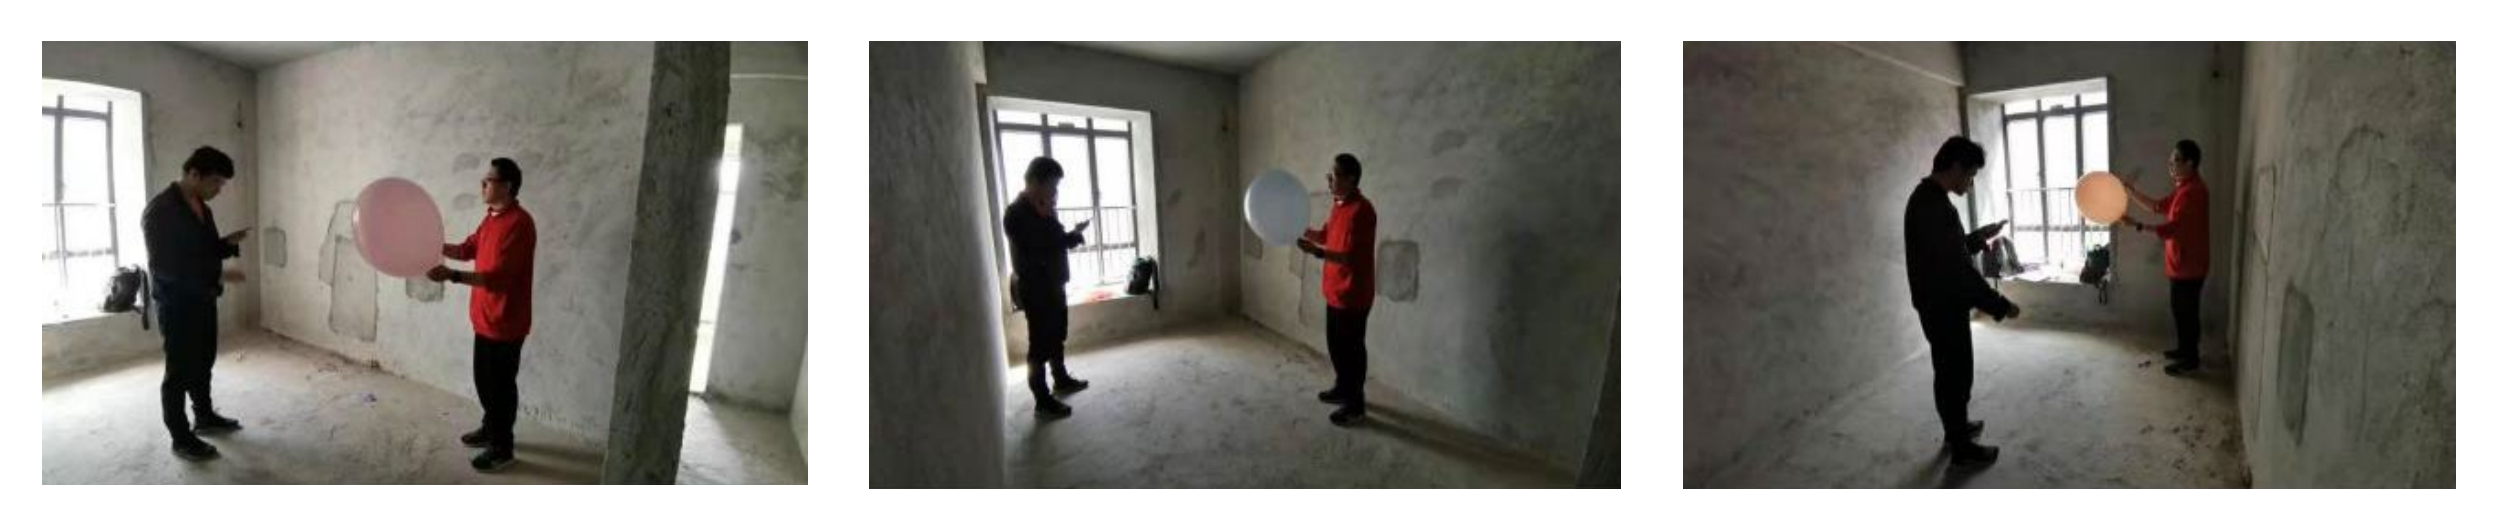
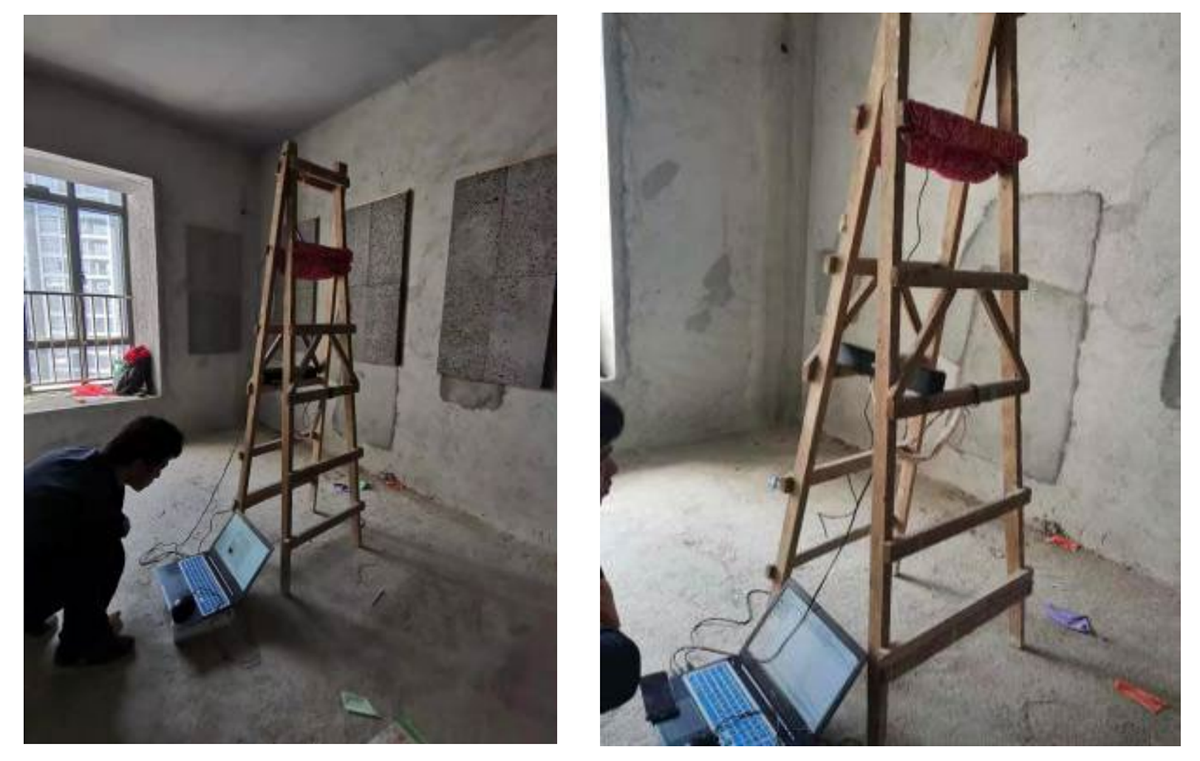
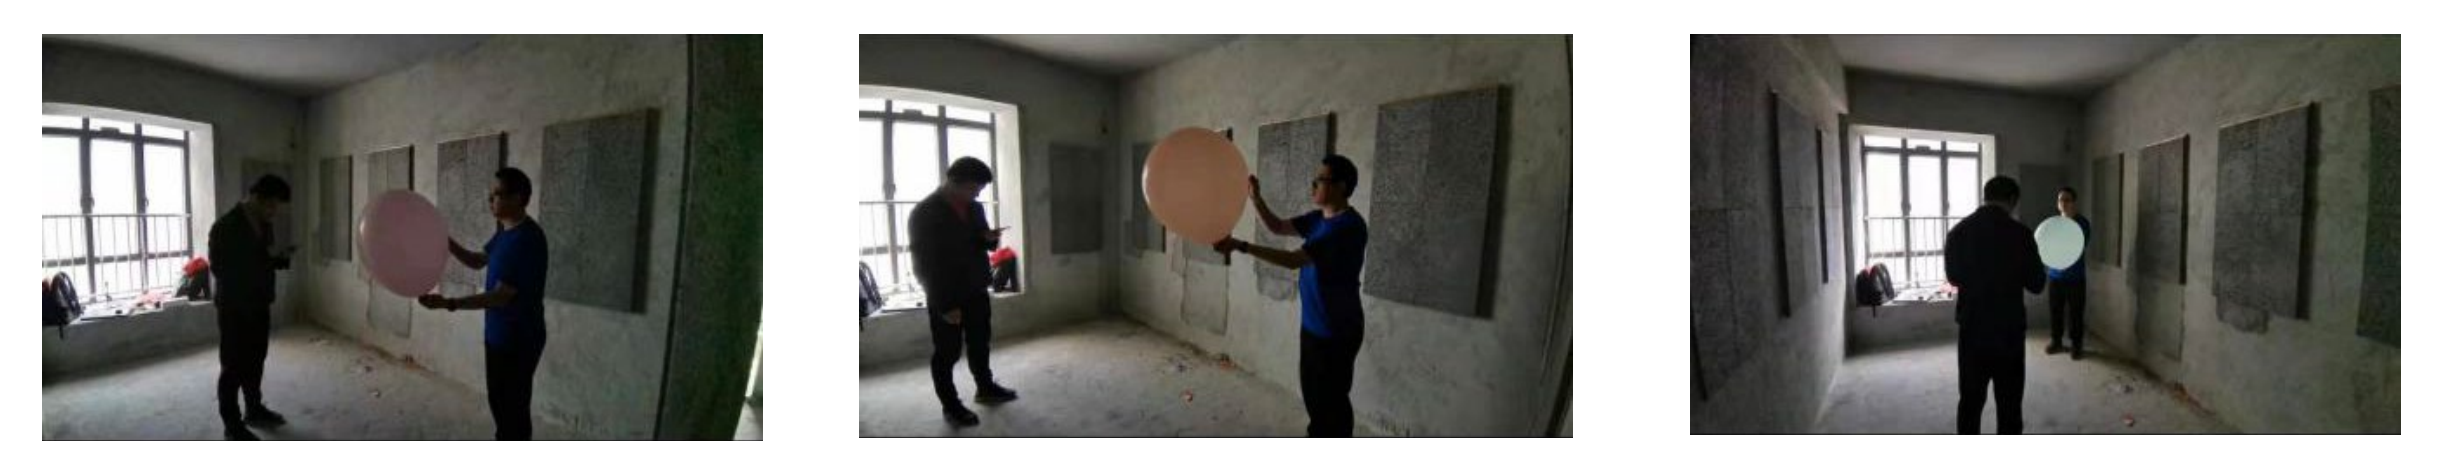
Method 1: This study uses 11 volcanic rocks with the size of 1.2 m × 0.6 m installed on four walls of the room, about 1 m high from the ground, and the distance between each wall was 0.3 m. In the renovated room, the balloons filled with gas at three set points were tested again in sequence. Figure 9 shows the measured spatial position and direction, and Figure 10 shows the measured data value of AudioTool at each point.
Materials and Methods
Volcanic Rock Material
In recent years, with the rapid development of China’s economy, China’s construction speed has accelerated, and the production of building materials has also accelerated [25]. In the context of building a harmonious, energy-saving and environmentally friendly society, the stone industry must eliminate products with serious radiation pollution and backward technology [26]. The current consumption concept has shifted from the original “surface” to “internal” and emphasizes the importance of environmental protection. Although volcanic rock is only a grey material, it gives a feeling of elegance and richness. Therefore, the use of volcanic rock in the interior decoration can not only achieve an elegant and beautiful appearance of the space, but also reflect the quality required by the owner. In this case, volcanic rock is undoubtedly the best choice for decorative materials [27]. In addition, its environmental advantages make it a leading product in natural stone products. The increasing focus on health and nature conservation will make volcanic materials the dominant material in the market. Volcanic rock is a new product in the stone industry and has many advantages. Particularly, it has both stone characteristics and its unique decorative style and particularity. The comparison between basalt and marble stone shows that marble stone contains higher radioactive substances. Therefore, in recent years, more and more people have given up the idea of using marble stone for home interior decoration. In contrast, basalt is low in radioactivity and can be safely applied in the daily life of humans for the comfort of consumers [28].
Further, volcanic stone can resist weathering, withstand outdoor climatic conditions, absorb noise, improve the sound environment, prevent light pollution with its pure color characteristics, and improve the environment with visual factors in people’s daily work and life. At the same time, it can also absorb water and provide heat insulation, is anti-slip, improves the surrounding environment, plays the role of a “lung”, promotes the breathing of the entire space, adjusts the air humidity, and improves the ecological environment. In the field of architectural decoration, volcanic rocks maximize the concept of nature as the center and environmental protection. In addition, hard volcanic rocks can be made into ultra-thin slabs with a polished gloss of more than 85 degrees for outdoor wall and floor paving. It can be widely used in a variety of archaic architecture, European-style architecture, and garden architecture, which are highly praised by the decoration industry outside China [29]. Ultimately, volcanic rock cast stone pipe has excellent abrasion and corrosion resistance and can be used to replace harmful asbestos and glass products as well as metal materials. Volcanic rock cast stone pipe is lighter than metal pipe and has the same properties as the glass material, as well as nearly a century of service life. At the same time, its toughness and elasticity are better than steel. Therefore, combined with interior space design, this study discusses the characteristics of volcanic rocks in controlling the sound of teaching space.
Experiment Methods
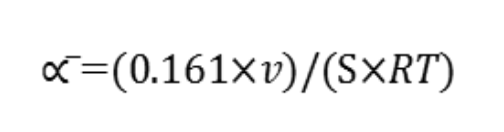
Based on Zhang et al.’s research on the correlation between the application of volcanic rock materials on indoor walls and acoustic quality control of indoor space [30], this study attempts to make a deeper discussion and analysis. Thus, in this study, volcanic rock was used as the main decoration material for indoor wall, and the sound absorption coefficient was tested by computer software simulation. In this study, software tools such as AudioTool and REW were used to measure and compare the RT sound absorption performance of the rough-cast room decorated with hanging volcanic rock plates before and after renovation. This test is calculated according to the Sabin formula in Figure 1 to obtain the mean sound absorption coefficient and volume size. By comparing the acoustic absorption coefficients before and after replacement, the possible acoustic absorption coefficients of volcanic plates are derived. Finally, the estimated sound absorption coefficient of the volcanic rock plate is input into the acoustic simulation software ODEON for acoustic simulation experiments on ordinary teaching spaces.
Xizhi Zhang 1 ,
Kuo-Hsun Wen 2*
(a) Left data
Experiment Process
Tests Before Transformation
Tools: Balloon, AudioTool, REW acoustic measurement software, SUPERLUX ECM999, SONY Ericsson A6 computer MAGNETICALLY SHIELDED, and Dell i5 laptop.
Method 1: In this study, balloons filled with gas were placed at three locations in the test room and blasted separately. The cause of gas explosion was the rapid expansion of gas in a narrow space, accompanied by the violent vibration of the gas itself, resulting in a huge sound, because the sound was generated by the vibration of the object and propagated through the medium. When the balloon exploded, the sound was caused by the sudden expansion of the gas volume in the balloon and the violent vibration of the gas itself. Then, when the balloon exploded, the vibrations and sounds of the gas quickly disappeared. According to the previous test procedure records, RT before its conversion was measured by the audio tool. Figure 2 shows the measured spatial position and direction, while Figure 3 shows the data measured by AudioTool in individual directions.
Share and Cite
Chicago/Turabian Style
Wei Zhang, Xizhi Zhang, and Kuo-Hsun Wen, "Acoustic Quality of Volcanic Rock Material for Interior Space Control and Design: Evidence From Teaching Space." JDSSI 1, no.3-4 (2023): 56-83.
AMA Style
Wei Zhang, Xizhi Zhang, and Kuo-Hsun Wen. Acoustic Quality of Volcanic Rock Material for Interior Space Control and Design: Evidence From Teaching Space. JDSSI. 2023; 1(3-4): 56-83.
© 2023 by the authors. Published by Michelangelo-scholar Publishing Ltd.
This article is published under the Creative Commons Attribution-NonCommercial-NoDerivs 4.0 International (CC BY-NC-ND, version 4.0) license (https://creativecommons.org/licenses/by-nc-nd/4.0/), which permits non-commercial use, distribution, and reproduction in any medium, provided the original work is properly cited and not modified in any way.
References
1. C. M. Chiang and C. M. Lai, “Acoustical environment evaluation of Joint Classrooms for elementary schools in Taiwan,” Building and Environment 43, no. 10 (2008): 1619-1632. [CrossRef]
2. G. I. Earthman, C. S. Cash, and D. Van Berkum, “A statewide study of student achieves and behavior and school building condition,” 1995 (ERIC Document Reproduction Service No. ED387878).
3. G. I. Earthman, “The impact of school building condition and student achievement, and behavior,” 1998 (ERIC Document Reproduction Service No. ED441329).
4. G. I. Earthman and L. Lemaster, “Where children learn: a discussion of how a facility affects learning,” 1998 (ERIC Document Reproduction Service No. ED419368).
5. M. M. Edward, “Building conditions, parent involvement and student achievement in the D. C. public school system,” 1991 (ERIC Document Reproduction Service No. ED338743).
6. L. E. Maxwell, “School building renovation and student performance: one district’s experience,” 1999 (ERIC Document Reproduction Service No. ED443272).
7. M. Kennedy, “Creating ideal facilities,” American School & University 74, no. 5 (2002): 30–33.
8. J. A. Lackney, “Reading a school building like a book: The influence of the physical school setting on learning and literacy,” 1999 (ERIC Document Reproduction Service No. ED433692).
9. J. Li, “Study on Effect of Classroom Acoustic Environment on Students’ Learning Effects,” in Acoustic Science in Information Society — the Acoustical Society of China 2010 National Member Congress and Academic Conference Paper Collection (Acoustical Society of China, 2010), 2.
10. Y. Song and S. Sheng, “Progress of Indoor Acoustic Research in the Classroom,” Acoustic Technology, no. 1 (2006): 56–61.
11. J. Wang, “Book Review of ‘Noise Control and Sound Comfort’,” Acoustic Technology 32, no. 1 (2013): 45.
12. Y. Song, S. Sheng, and P. Zhu, “Tongji University Classroom Indoor and Outdoor Noise Survey,” Journal of Tongji University (Natural Science Edition), no. 3 (2007): 372–376.
13. Y. Song, “Study on Sound Absorption Performance of Micro-penetration Board Space Sound Absorb,” in Architectural Society of China Architectural Physics Branch: Construction Physics Branch of the Architectural Society of China (Architectural Society of China Architectural Physics Branch, 2004), 4.
14. H. Xu and D. Ou, “Overview of Classroom Acoustic Environment Study Progress,” Building science 31, no. 8 (2015): 35–40.
15. H. Xu, “Overview of Research Progress of Classroom Acoustics outside China,” in 2014 National Acoustical Conference of Acoustical Society of China (Acoustical Society of China, 2014).
16. “Paper Collection,” in Acoustical Society of China: Editorial Department of Acoustic Technology (2014), 4.
17. K. Rahul, M. Zhichao, S. Sivaramapanicker, et al., “Real time size-dependent particle segregation and quantitative detection in a surface acoustic wave-photoacoustic integrated microfluidic system,” Sensors & Actuators: B.Chemical (2017): 252. [CrossRef]
18. Y. Song, P. Zhu, and S. Sheng, “Study on optimal RT in classroom space,” Acoustic Technology 28, no. 1 (2009): 48–52.
19. C. Che-Ming and L. Chi-Ming, “Acoustical environment evaluation of Joint Classrooms for elementaryschools in Taiwan,” Building and Environment 43, no. 10 (2007).
20. L. H. A. Bos-Bonnie, E. A. M. Jan, E. T. P. Van Bergen, et al., “Effectiveness of an individual, online e-learning program about sexually transmitted infections: a prospective cohort study,” BMC Family Practice 18, no. 1 (2017). [CrossRef]
21. N. J. Dudley, “Ultrasound probe acceptance testing using the in-air reverberation pattern,” Ultrasound in Medicine & Biology 45, no. 6 (2019): 1475–1482 [CrossRef].
22. Tiangang You, “Discussion on the application of architectural Acoustics in Architectural Decoration,” Chinese Science and Technology Journal Database (Abstract Edition) Engineering Technology, no. 4 (2022): 0028-0030.
23. Xinjian Liang and Hongmei Zhou, “Optimization and renovation design based on Existing reverberation chamber,” Journal of Guangxi University of Science and Technology 32, no. 4 (2021): 93-99.
24. Dong Xie, Xiaoli Xie, Yang Yang, et al., “Influence factors and improvement measures of sound insulation performance of common wall,” Acoustic Technology 42, no. 4 (2019): 515-523.
25. F. R. E. Forme and D. Fontaine, “Enhanced ion acoustic fluctuations and ion outflows,” Annales Geophysicae 17, no. 2 (2018).
26. C. Li and M. Zhu, “Analysis on crack of highway asphalt pavement,” Dossier 107, no. 3 (2013): 104.
27. L. Song, “Coal and oil are formed by volcanic eruptions,” Super Science (Mysteries of Science), no. 8 (2012): 53.
28. “Analysis of volcanic stone products and their development prospects,” April 25, 2008, www.stone365.com, taken from http://www.stone365.com/news/info-10710.html.
29. “Application of volcanic rock as a stone material and its value,” May 5, 2016, www.stone365.com, yaken from http://www.stone365.com/news/info-8450467355811.html.
30. W. Zhang, X. Z. Zhang and KH. Wen, “Volcanic Rock Material and Interior Space Acoustic Quality Control for Learning Space,” in 2022 IEEE 4th Eurasia Conference on IOT, Communication and Engineering (ECICE) (Yunlin, Taiwan, 2022), 458-462. DOI: 10.1109/ECICE55674.2022.10042876.
31. Y. Pang, F. Zhang, H. Qiu, et al., “Acid volcanic rock reservoir micro-porous structure and physical parameter characteristics,” Acta petrolei sinica 28, no. 6 (2007): 72–77. DOI:10.3321/j.issn: 0253-2697.2007.06.014.
32. X. Ren, F. Gong, Shengxue Fu, “Acoustic quality control in large lecture room,” China Modern Educational Equipment, no. 6 (2007): 7–9. DOI:10.3969/j.issn. 1672-1438.2007.06.003.
33. C. Su, Preliminary study on acoustic environment in middle/small-sized classrooms (Guangzhou: South China University of Technology, 2010).
34. C. Liu, “Experimental research on characteristics of different types of classroom acoustic environments in universities,” Environmental Science and Management 37, no. 3 (2012): 69–72. DOI:10.3969/j.issn. 1673-1212.2012.03.017.
(d) Posterior vocalisation
(c) Right vocalisation
Acoustic Simulation Results of Volcanic Rock Material
The RT calculation results are based on the calculation function that takes the average value over multiple points. In this study, the acoustic field characteristics of the lecture room space under two methods are as follows:
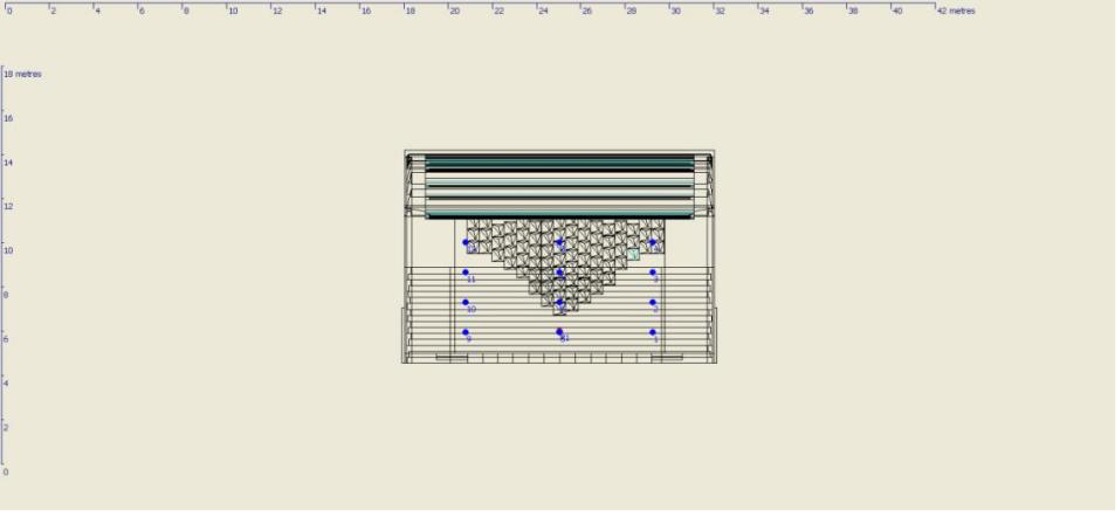
- The multi-point response method was used to arrange the number of measuring points in the room, calculate the acoustic parameter values of these points, and then obtain the average value and standard of the same sound quality parameters. The resulting distribution characteristics of the sound field in the room are displayed in Table 5.
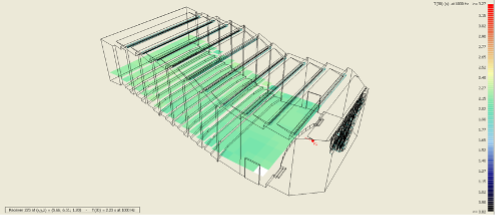
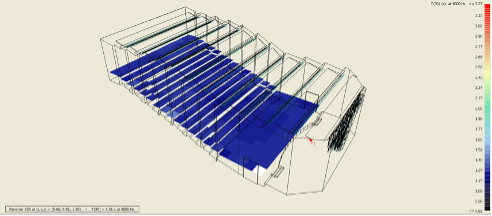
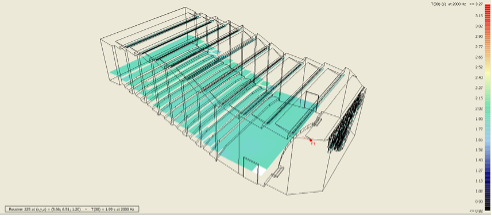
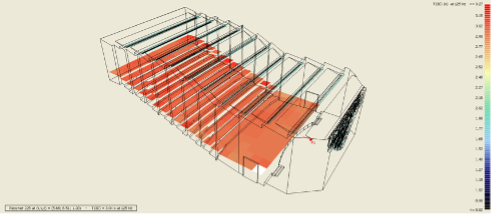
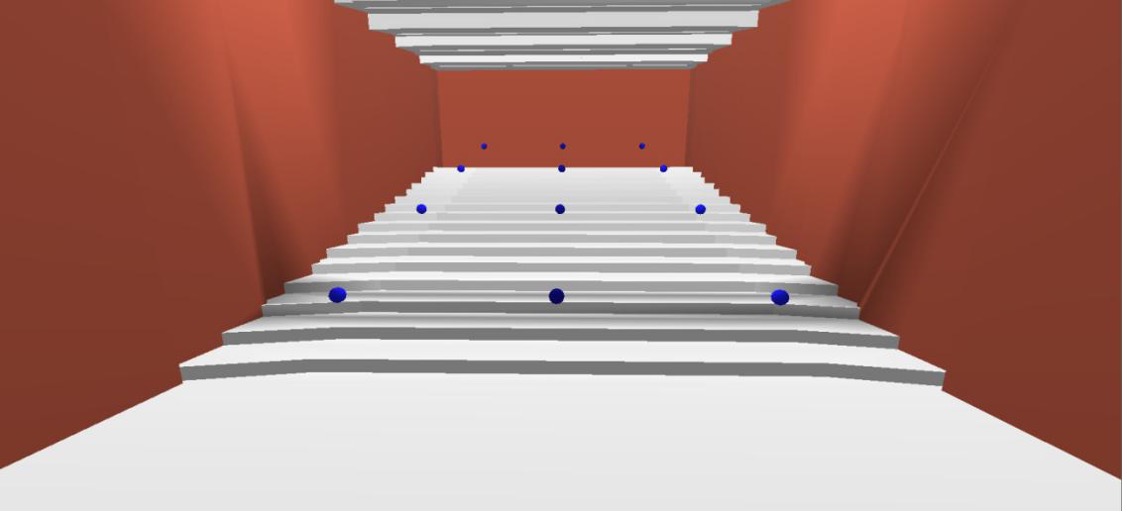
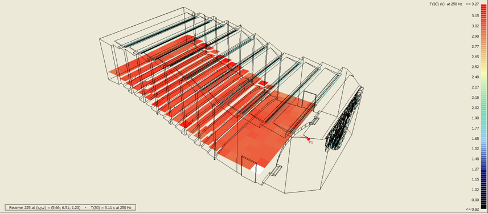
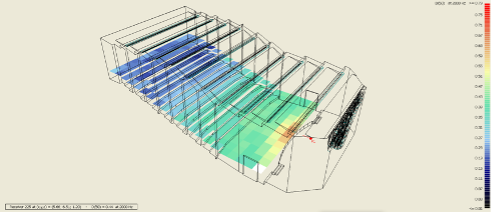
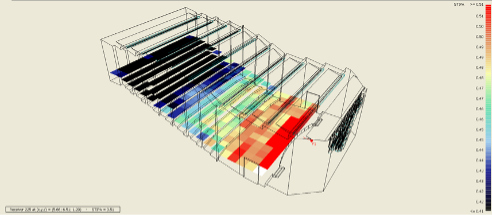
- The grid response method was used to divide the room space into grids and to study the acoustic field characteristics of each grid in order to obtain the acoustic characteristics of the whole room. In this simulation, the plane including the audience positions in the teaching space of the lecture room was divided into units sized 2 m × 2 m and located 1.1 m above the ground. The results are displayed in a colour grid.
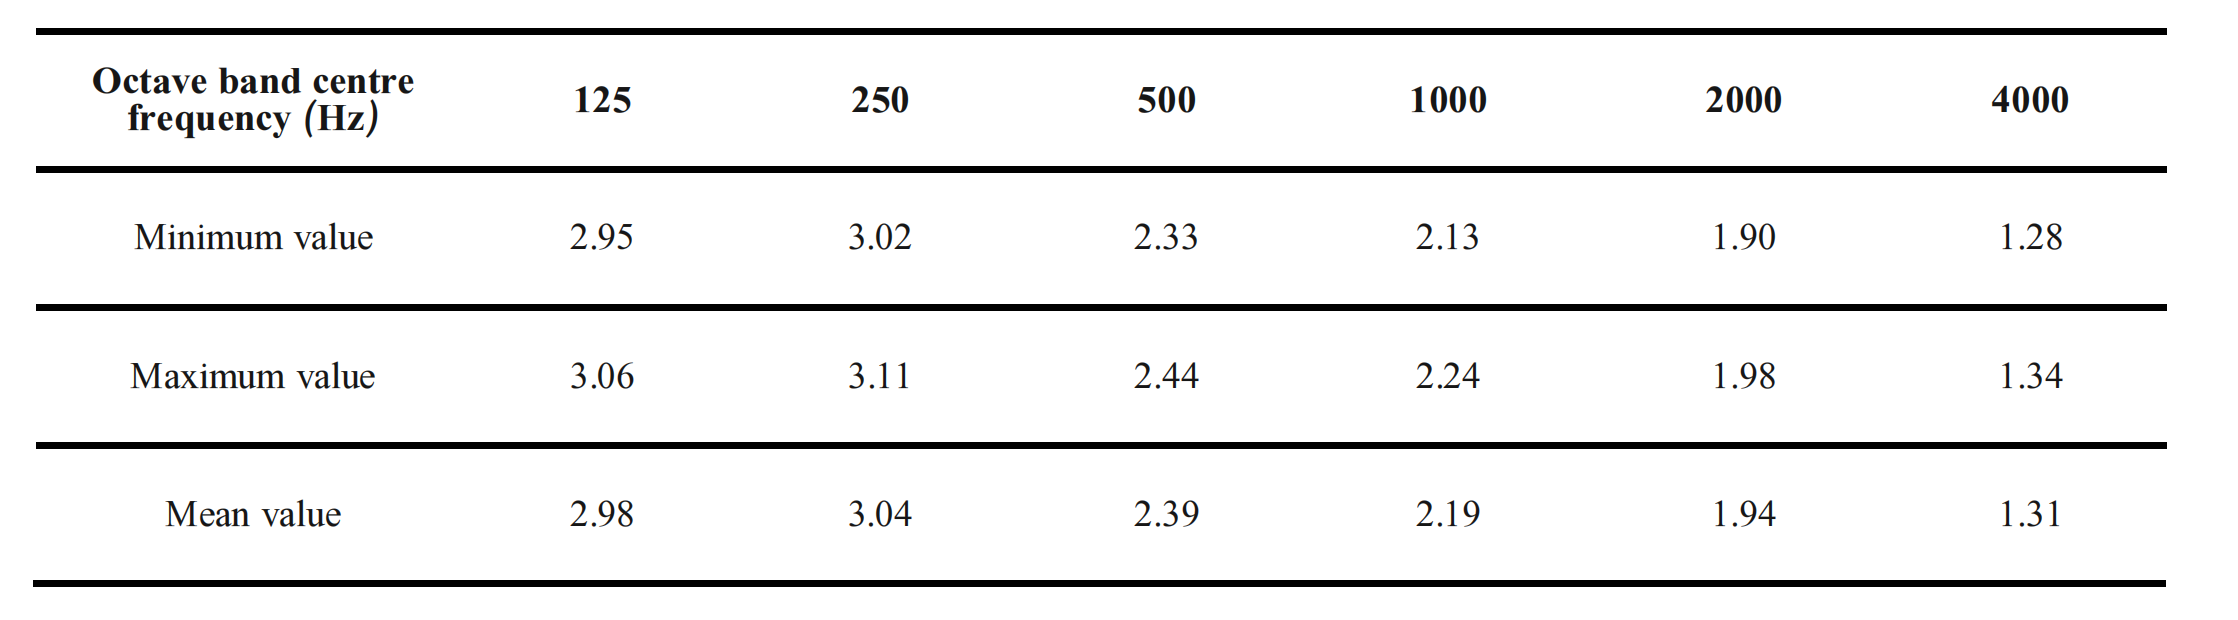
- An acoustic RT simulation of the volcanic rock wall was performed (S) (Table 5).
- The RT distribution diagram of six octaves ranging between 125 Hz and 4000 Hz in the teaching space of the lecture room was obtained (Figure 30-35).
(b) Perspective of the teaching space of the lec-ture room
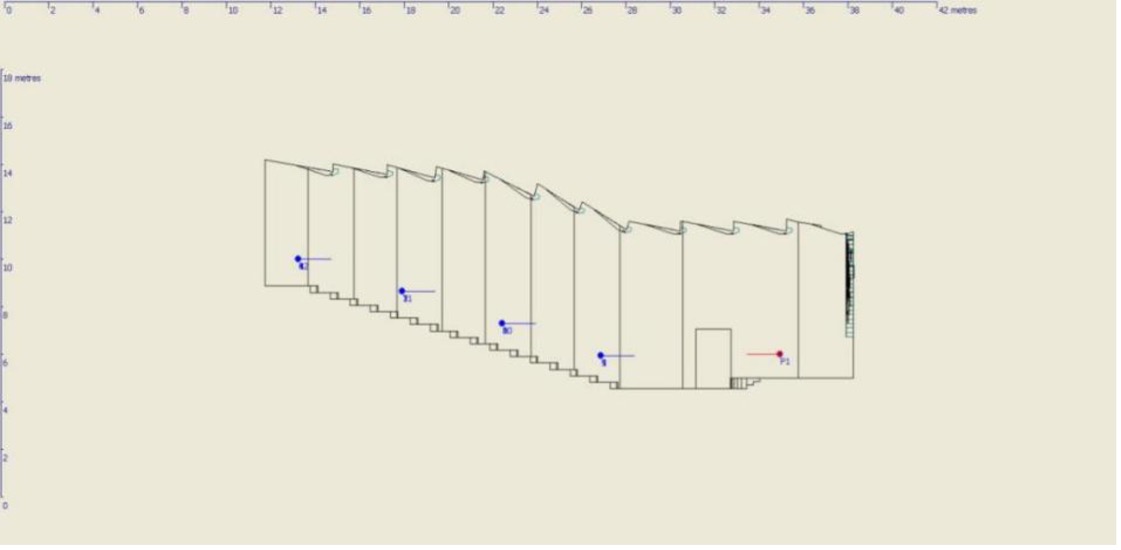
(a) Layout plan of the teaching space of the lecture room
Acoustic Simulation of the Volcanic Rock Material on the Walls of the Teaching Space in the Lecture Hall
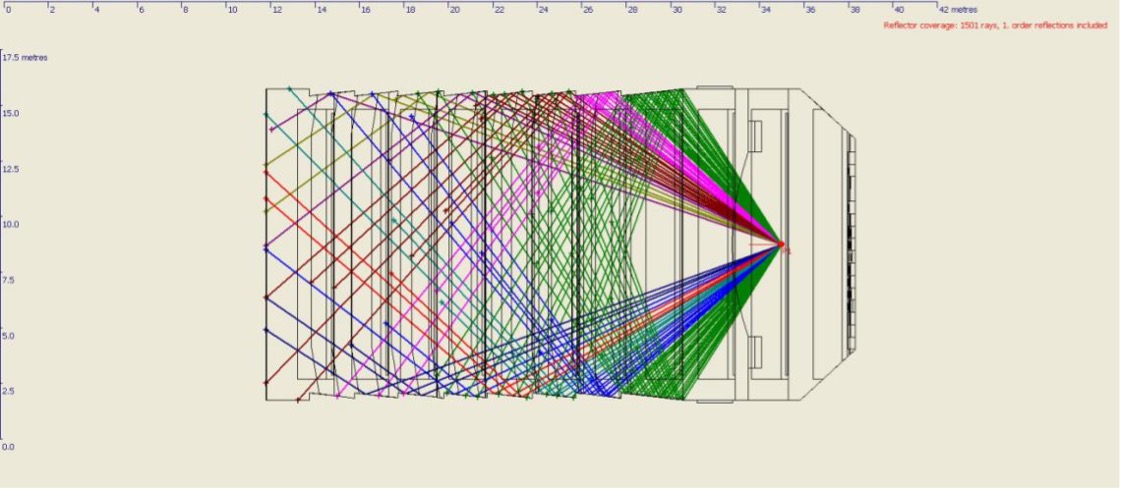
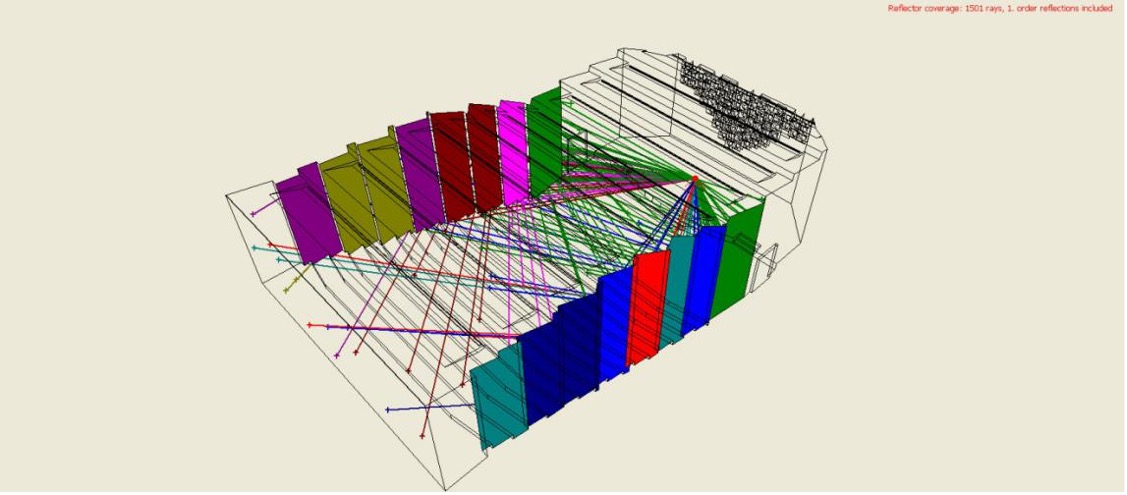
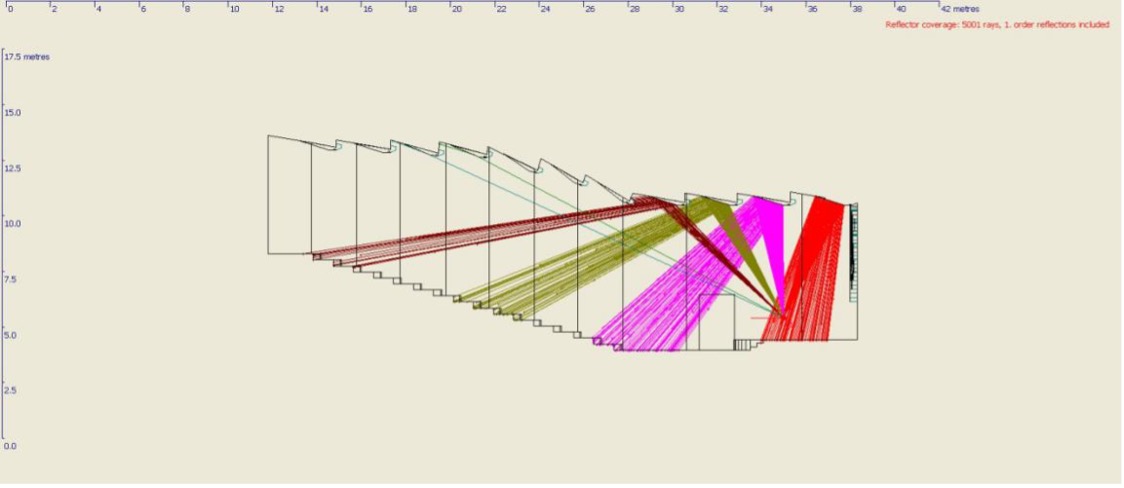
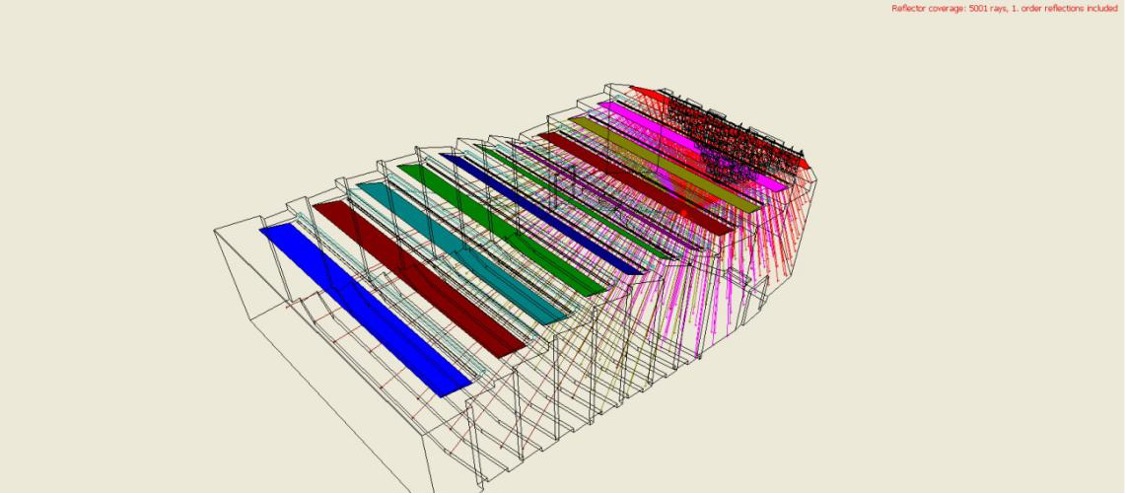
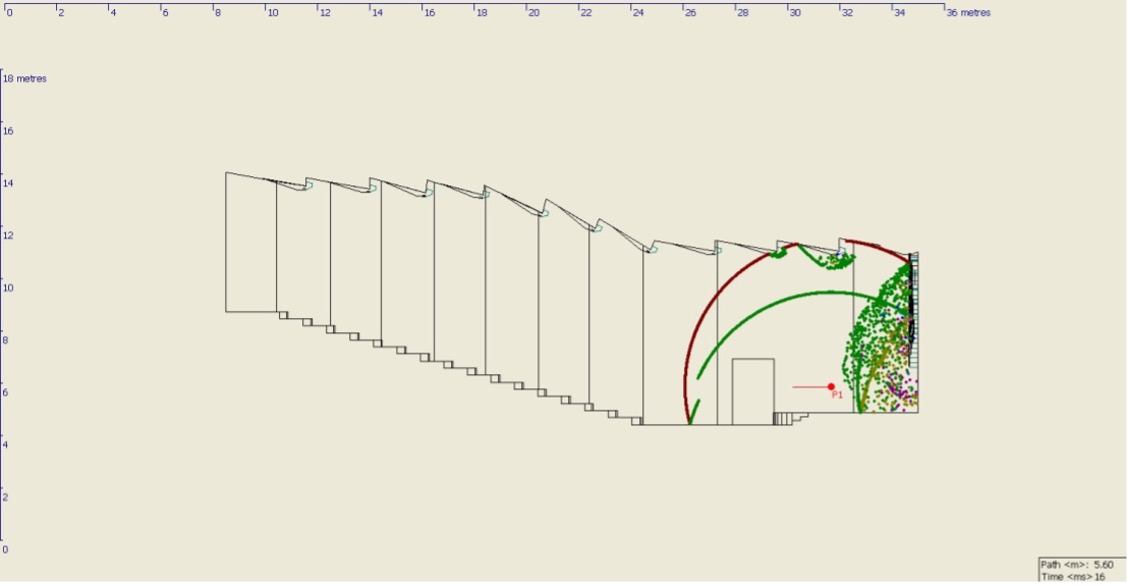
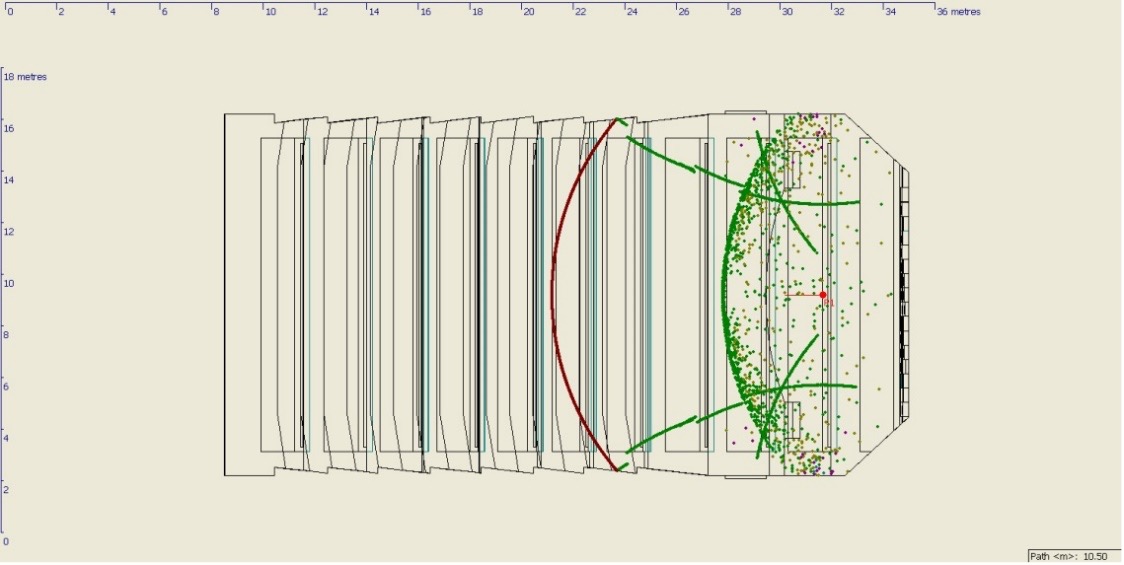
The method of computer simulation adopted in this paper is based on the simulation software ODEON, which is based on architectural acoustics. Methods of virtual sound source and harmonic line tracking combined with sub-sound source are used to simulate the computer sound field with visual and functional display.
Accordingly, the main simulation experiment of this study is to predict the characteristics of the RT sound field in the teaching space of multifunctional lecture hall. The test sound source is set as a non-directional sound and placed 1.5 m behind the stage curtain line.
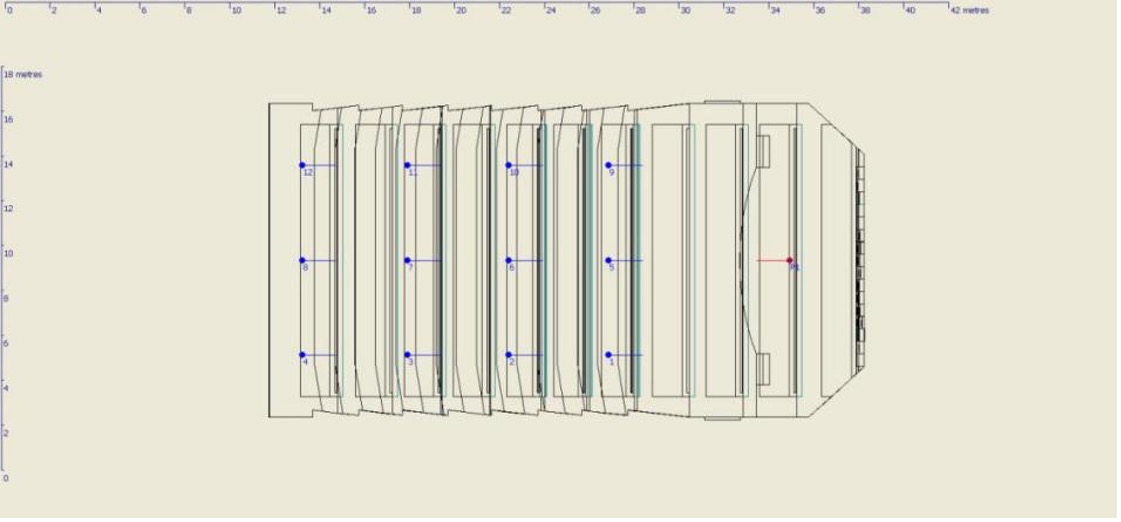
Based on the above basic conditions and considering the test method of non-directional ideal sound source OMNI, this simulation adopts a SO8 position point placed 1.5 m above the ground, whose coordinates are (3.3,0,1.5).
Measuring points: In this test, 12 measuring points were set in the audience area, which were all 1.1m away from the ground, as shown in Figure 18-29.
Conclusions
In this paper, the physical characteristics and sound absorption coefficient of volcanic rock are analyzed and measured, and the sound quality control of lecture hall is discussed. After setting various assumptions and conditions of the experimental objects, the acoustic absorption coefficients of volcanic rocks measured in this study are 0.12 and 0.14 in the medium frequency range of 500 ~ 1000 Hz, and 0.26 in the high frequency range of 4000 Hz. All these data show that volcanic rock material has a certain sound absorption effect when used as the decorative surface of an indoor wall. In addition, the results of acoustic simulation also show that the volcanic rock surface material used in the wall of a lecture hall with a teaching function is sufficient to meet the requirements of different users, and has a certain degree of sound quality control, although the test simulation results show that the system in the mid-frequency band sound absorption and reverberation performance is poor. However, the sound absorption and reverberation performance in the high frequency bands are satisfactory. Consequently, the use of volcanic rock material as a wall decoration has the opportunity to improve students’ concentration and efficiency in classroom, which is in line with the design of a good campus learning space discussed in this paper. Based on the hypothesis and experimental equipment, this study can only use the existing computer simulation software to implement the scheduled test items, collect data and make an analysis. Therefore, this experimental method and procedure may have the following limitations:
- Although the experimental process of sound absorption coefficient of volcanic rocks conforms to the test principle of the reverberation chamber method, but the test is set in an open space, and the sound may be affected by various environmental noises, so the data may be slightly biased.
- Because only the reverberation chamber method is used in this experiment, and no comparison is made with standing wave method, the data obtained are relatively simple.
- Since this paper only summarizes and discusses the experiment of sound absorption coefficient of volcanic rocks, it lacks any discussion of related factors such as sound reinforcement system and acoustic design.
Through the discussion of sound quality control in the early stages, the test experiment in the middle stage and computer simulation at the end, the selection of wall decoration materials in the teaching space has fully demonstrated the characteristics of volcanic rock material, sound absorption coefficient and reverberation time. The experimental results of this paper can be used as the basis for promoting the sound quality test of teaching space in realizing the choice of wall decoration materials in teaching space design, to achieve control of the acoustic quality, and then improve the learning efficiency of students. Due to the physical properties of volcanic rocks, they can be used as decoration materials. However, when the weight of the material is heavier, construction is more difficult. Therefore, it is necessary to further consider how to effectively apply volcanic rock decorative materials to indoor walls with control requirements for sound quality, and more consideration should be given to wall structure and space design to accurately improve the acoustics of teaching and learning spaces. All in all, taking this study as an example, the test methods, experimental steps and simulation through computer software can provide a valuable reference for the research and testing of acoustic quality control in teaching spaces, in order to study and simulate the effect of other materials in spatial sound quality control, expand the diversity of interior and interior wall decoration materials, and then create a good acoustic environment in the teaching space.

The statistical analysis of the volcanic rock wall material was carried out on the simulation results of 12 measuring points, as well as the colour grid diagram of the acoustic quality parameters in the room.
Thus, the acoustic quality of the room was predicted to a certain extent. The results are summarised as follows:
The results show that the mean value of intermediate frequency RT (500Hz and 1000Hz) of the lecture hall decorated with volcanic rock material is 2.29s, which is close to the 1.31s calculated by Chen [34]. However, it is quite different from the standard reference value of RT≤0.8 set in China’s National Code for Sound Insulation Design of Civil Buildings. Of course, this also has a strong relationship with the volume of the lecture hall and the construction technology of the wall decoration where the mean D50 measured 0.27, although slightly below the design requirement of 0.5, but the speech clarity is significantly poor. In addition, the average STIPA of its sound reinforcement system is 0.43, which is also lower than the design requirement of 0.5.
Email: mspl@michelangelo-scholar.com
Tel: +852-66761250
WHATSAPP:+60 11-2370 2845
Room A, 3/F, Wing Tat Commercial Building, 121–125 Wing Lok Street, Sheung Wan, Hong Kong, China


JDSSI
MSPL
JACAC
DH
JAUD