
2. Methodology
This study adopts a qualitative approach to explore how behavioral profiling can inform the design of effective data communication formats in a marginalized community. Participants were teenagers aged 13–15 from Campana-Altamira. Ten students were selected for the profiling-writing activity, thirteen participated in co-design workshops divided into three groups, and six teenagers as samples for Speculative Profile Mapping exercises developed from the co-design process with university students.
Speculative Profile Mapping was developed as a qualitative, empathic design tool to help researchers and educators imagine plausible future trajectories for Campana-Altamira teenagers based on observed behaviors and workshop interactions. Conducted with university students following initial engagement sessions, this exercise aimed to capture insights about how local youth might grow to contribute to their community, despite limited time for direct relationship-building. While inherently subjective and shaped by the perspectives of outsiders, SPM served to inform more nuanced, context-sensitive intervention strategies by anticipating students’ potential needs, motivations, and opportunities for involvement in local problem-solving.
Data collection of the profiling-writing included 100-word written passages describing admired figures, categorization of gamer-like behavioral types (Explorer, Achiever, Socializer, Competitor), classroom observations, and participant reflections. Analysis involved multiple stages. Written passages were examined using thematic analysis alongside automated profiling tools. The Apply Magic Sauce API (University of Cambridge) provided open-text estimates of psychological gender, Big Five personality traits, Jungian personality types (MBTI), and leadership potential. While these outputs are indicative rather than precise, the Big Five and leadership dimensions were prioritized for interpretation. Additional analysis employed prompt-engineered large language models to extract motivational themes. Workshop profile data, partly gathered by Tecnológico de Monterrey university students, underwent iterative analysis to refine behavioral categorizations. Participants’ gamer-type mappings offered a framework for understanding motivational orientations.
These profiles were not treated as fixed outcomes but as design guides. By aligning communication strategies with intrinsic motivators, the research developed heuristics for tailoring data presentation. For example, Explorers may respond to open-ended maps and discovery tools, Achievers to gamified dashboards or progress tracking, Socializers to group-based dialogue and relational stories, and Competitors to leaderboards or challenge-based formats. While the profiling approach remains lightweight and is not formal psychometric testing, it offers practical insights into designing community data systems that are more engaging, relevant, and capable of motivating local action.
Table of Contents
- Abstract
- Introduction
- 1. Theoretical Framework
- 2. Methodology
- 3. Case Study: Campana-Altamira
- 4.Discussion: Designing Social Data Systems
- Conclusion
- Author Contributions
- Funding
- Acknowledgements
- Conflicts of Interest
- Author Biographies
- References
Leveraging Data Communication Systems to Empower Local Innovations in Marginalized Slum Communities through Behavioral Profiling
References
1. Sustainability Directory. “Community Data Empowerment.” PRISM Sustainability Directory. Accessed May 7, 2025. https://prism.sustainability-directory.com/term/community-data-empowerment/.
2. Patin, B., M. Sebastian, J. Yeon, and D. Bertolini. “Toward Epistemic Justice: An Approach for Conceptualizing Epistemicide in the Information Professions.” Proceedings of the Association for Information Science and Technology 57, no. 1 (2020). [CrossRef]
3. Zhu, X., and M. A. Freeman. “An Evaluation of U.S. Municipal Open Data Portals: A User Interaction Framework.” Journal of the Association for Information Science and Technology 70, no. 1 (2018): 27–37. [CrossRef]
4. Gurstein, Michael B. “Open data: Empowering the empowered or effective data use for everyone?.” First Monday (2011). [CrossRef]
5. Barcellos, R., F. Bernardini, J. Viterbo, and A. Zuiderwijk. “Hippolyta: A Framework to Enhance Open Data Interpretability and Empower Citizens.” Proceedings of the 24th Annual International Conference on Digital Government Research, 191–198. [CrossRef]
6. Busette, C., K. L. Gilbert, G. R. Sanchez, K. Frimpong, and C. Bennett. “Supporting a Community Led Data Infrastructure to Build Local and Equitable Governance that Advances Policy.” Brookings Institution. Accessed from https://www.brookings.edu/articles/supporting-a-community-led-data-infrastructure-to-build-local-and-equitable-governance-that-advances-policy/.
7. Sudan, R., C. Hammer, and Y. Eferin. “Toward Bridging the Data Divide.” World Bank Blogs. Accessed Feb 24, 2025. https://blogs.worldbank.org/en/opendata/toward-bridging-data-divide.
8. London Business School. “Understanding Smartphone Usage in Low Income Markets.” London Business School. Accessed June 15, 2025. https://www.london.edu/news/understanding-smartphone-usage-in-low-income-markets-2006.
9. Ajengrastri, A. “Indonesian Survey Explores the Spread of Misinformation on WhatsApp.” International Center for Journalists. Accessed June 7, 2025. https://www.icfj.org/news/indonesian-survey-explores-spread-misinformation-whatsapp.
10. Data-Pop Alliance. Beyond Data Literacy: Reinventing Community Engagement and Empowerment in the Age of Data (White Paper Series). Data-Pop Alliance (Harvard Humanitarian Initiative, MIT Media Lab, and Overseas Development Institute) and Internews.
11. Acker, A., L. Bowler, and L. Pangrazio. “Guest Editorial: Special Issue—Perspectives on Data Literacies.” Information and Learning Sciences 125, no. 3/4 (2024): 157–162 [CrossRef]
12. Ologbosere, O. “Data Literacy and Higher Education in the 21st Century.” IQ 47, no. 3–4 (2023). [CrossRef]
13. Matthews, P. “Data Literacy Conceptions, Community Capabilities.” The Journal of Community Informatics 12, no. 3 (2016). [CrossRef]
14. Evans, S., L. Hong, J. Kim, E. Rice-Oyler, and I. Ali. “Community College Students’ Self-Assessment of Data Literacy: Exploring Differences Amongst Demographic, Academic, and Career Characteristics.” Information and Learning Sciences 125, no. 3/4 (2023): 232–251. [CrossRef]
15. Platter, H., K. Kaplow, and C. Baur. “The Value of Community Health Literacy Assessments: Health Literacy in Maryland.” Public Health Reports 137, no. 3 (2021): 471–478. [CrossRef]
16. Debruyne, C., L. Grehan, M. Hurley, A. Kearns, and C. O’Neill. “One Year of Dalida Data Literacy Workshops for Adults: A Report, 403–407.” [CrossRef]
17. Wolff, A., D. Gooch, J. Montaner, U. Rashid, and G. Kortuem. “Creating an Understanding of Data Literacy for a Data-Driven Society.” The Journal of Community Informatics 12, no. 3 (2016). [CrossRef]
18. Faris, M. “Comic for Developing Big Data Literacy.” Ultimacomm Jurnal Ilmu Komunikasi 14, no. 1 (2022): 35–51. [CrossRef]
19. Susha, I., Å. Grönlund, and M. Janssen. “Driving Factors of Service Innovation Using Open Government Data: An Exploratory Study of Entrepreneurs in Two Countries.” Information Polity 20, no. 1 (2015): 19–34. [CrossRef]
20. Brown, G., and M. Kyttä. “Key Issues and Research Priorities for Public Participation GIS (PPGIS): A Synthesis Based on Empirical Research.” Applied Geography 46 (2014): 122–136. [CrossRef]
21. Saadallah, D. “Utilizing Participatory Mapping and PPGIS to Examine the Activities of Local Communities.” Alexandria Engineering Journal 59, no. 1 (2020): 263–274. [CrossRef]
22. Murray, B., E. Falkenburger, and P. Saxena. “Data Walks: An Innovative Method for Community Data Sharing and Engagement.” Urban Institute. United States of America. Accessed July 8, 2025. https://coilink.org/20.500.12592/m91qr1.
23. Gangadharan, S. P. “Digital Inclusion and Data Profiling.” First Monday 17, no. 5 (2012). [CrossRef]
24. Lupi, G. “VIS Capstone Address Data Humanism: The Revolution Will Be Visualized.” In 2017 IEEE Conference on Visual Analytics Science and Technology (VAST), 1–1. IEEE, 2017. [CrossRef]
25. Dencik, L., A. Hintz, J. Redden, and E. Treré. “Exploring Data Justice: Conceptions, Applications and Directions.” Information, Communication & Society 22, no. 7 (2019): 873–881. [CrossRef]
26. Renzi, A., and G. Langlois. “Data Activism.” In Compromised Data: From Social Media to Big Data, 202–225. London: Bloomsbury, 2015.
27. Thompson, L., T. Luzuriaga, and B. Benson. “Work in Progress: Gamification of Education: Using Bartle’s Taxonomy for Inclusive Educational Practices.” Paper presented at 2022 ASEE Annual Conference & Exposition, Minneapolis, MN, August 2022. [CrossRef]
28. Schneider, M. O., É. T. U. Moriya, A. V. da Silva, and J. C. Néto. “Analysis of Player Profiles in Electronic Games Applying Bartle’s Taxonomy.” Proceedings of SBGames, 2016.
29. Kosec, K., and L. Wantchekon. “When Information Leads to Better Governance in Rural Areas—and When It Doesn’t.” IFPRI Blog, October 18, 2019. https://www.ifpri.org/blog/when-information-leads-better-governance-rural-areasand-when-it-doesnt/.
30. Silberstein, J. “Knowledge Is Not Always Power.” RISE Programme, August 12, 2020. https://riseprogramme.org/blog/knowledge-is-not-always-power.html.
31. Iniciativa Campana Altamira. “Iniciativa Campana Altamira.” Accessed April 28, 2025. https://campanaaltamira.org.
32. Parra, V. “Transforming Communities: The Campana-Altamira Initiative and Social Innovation in Action.” Manage-ment Studies: International Journal of Administration 16 (2024): 209–217. https://www.redalyc.org/journal/7198/719878994010/719878994010.pdf.
33. González Sánchez, X. Community Participation & Empowerment in Informal Settlement Upgrading: A Case Study in Monterrey, Mexico (MSc thesis, Delft University of Technology, Delft, The Netherlands, 2022). Faculty of Architecture and the Built Environment.
34. Centro CEMEX-Tec para el Desarrollo de Comunidades Sostenibles. “Monitoring Study Report: Campana-Altamira Polygon (Estudio de Monitoreo Polígono Campana-Altamira—Reporte de Resultados).” Monterrey, Mexico, May 2021.
35. Martínez Baca, A., H. Martínez Nimi, S. Aristi, and J. C. Chacón Quintero. “PULI Program Tec de Monterrey-Chiba University 2023: Co-Designing a Cross Cultural Educational Program for Social Good.” IFE Conference Proceedings, 2024. https://doi.org/10.5281/zenodo.13764010.
36. Nimi, H., A. Martínez Baca, S. Aristi, and J. C. Chacón Quintero. “PULI Project Semillas Del Futuro: Implementing Design-Led Education to Transform Communities.” In Cumulus Conference Proceedings Series: Design Across Borders United in Creativity, Monterrey 2024, 957–973. Cumulus Association with Universidad de Monterrey and Tecnológico de Monterrey, 2024.
Author Contributions
Savira Aristi led the conceptualization, methodology design, data collection, and writing of the manuscript. Co-authors Hisa Martinez Nimi and Juan Carlos Chacon Quintero supervised the research process and provided critical revisions to the manuscript. Alejandro Martinez Baca and Kenta Ono contributed to the design and implementation of the workshop and experimental setup, as well as data validation and review. All authors reviewed and approved the final version of the manuscript.
Funding
Not applicable.
Acknowledgements
The authors would like to express their gratitude to the Campana-Altamira community for their generosity, participation, and insights throughout this research. Special thanks are extended to Campana-Altamira Iniciativa for their continuous collaboration and support in facilitating community engagement and local activities.
Conflicts of Interest
The author declares that there are no conflicts of interest related to this research.
About the Author(s):
▪ Savira Aristi is a PhD researcher at the System Planning Laboratory, Chiba University, Japan. Her research explores design-led social innovation, behavioral design, and AI-mediated community empowerment. She has conducted participatory design workshops in Indonesia and Mexico, focusing on data and local innovation.
▪ Hisa Martinez Nimi is an Assistant Professor at the Faculty of Data Science at Chiba University in Japan. She completed her PhD studies in Design Science at Chiba University and has been awarded two Good Design Awards. She recently led international design projects about Data Visualization and Communication Design. Her teaching disciplines include Visual Communication Design, Data Visualization, and Design Thinking, and her interests include Design Science, Data Visualization, Image Generation, Branding, and Communication Design.
▪ Juan Carlos Chacon Quintero is an Assistant Professor at the Faculty of Data Science at Chiba University in Japan. He completed his PhD studies in Design Science at Chiba University. His teaching disciplines include Machine Learning and Design, Interactive Design, and Prototyping, and his interests include Image Generation, Human–Computer Interaction, Machine Learning in the Design Process, and Data Visualization.
▪ Alejandro Martinez Baca is a Professor at the School of Architecture, Art and Design at Tecnológico de Monterrey in Mexico.
▪ Kenta Ono is a Professor at the Faculty of Science and Engineering at Chiba University in Japan.
1 Graduate School of Science and Engineering, Chiba University, Chiba, Japan
2 Faculty of Data Science, Chiba University, Chiba, Japan
3 School of Architecture, Art and Design, Tecnológico de Monterrey, Monterrey, México
4 Faculty of Science and Engineering, Chiba University, Chiba, Japan
* Author to whom correspondence should be addressed.
JDSSI. 2025, 3(3), 54-79; https://doi.org/10.59528/ms.jdssi2025.1019a40
Received: August 19, 2025 | Accepted: September 29, 2025 | Published: October 19, 2025
Savira Aristi 1 *, Hisa Martinez Nimi 2, Juan Carlos Chacon Quintero 2, Alejandro Martinez Baca 3, Kenta Ono 4
by

Abstract: This paper examines Community Data Empowerment (CDE) as a framework for supporting marginalized slum communities to use data in ways that drive locally led problem-solving and innovation. While open data initiatives often fail to reach or empower low-income neighborhoods due to resource barriers and technical complexity, many marginalized slum communities are in fact digitally connected and eager for relevant, actionable information. Focusing on the Campana-Altamira community in northern Mexico, this study uses workshops and school-based activities with teenagers to explore motivational patterns through participatory behavioral profiling and speculative mapping. Students’ short essays about role models were analyzed using thematic coding and automated tools such as Apply Magic Sauce and Large Language Models Artificial Intelligence (ChatGPT), revealing diverse motivational archetypes including Achievers, Competitors, Socializers, and Explorers. Rather than treating these profiles as fixed categories, the study uses them as design heuristics for tailoring data communication strategies that align with local values and preferences. This includes developing narrative, visual, and interactive formats that make data more engaging, relatable, and actionable.
The findings suggest that effective CDE requires more than attractive visuals or technical dashboards. It demands participatory, context-sensitive design that respects local motivations, provides clear pathways to act, and offers incentives for collective problem-solving. By centering community voices and creating tools that invite meaningful engagement, CDE can help seed grassroots innovation, strengthen local governance, and empower residents as agents of change.
Introduction
Community Data Empowerment (CDE) refers to the process of enabling local communities to collect, access, and use data in ways that empower them to drive positive change [1]. In essence, CDE shifts data-driven innovation from elite institutions directly into the hands of community members. The core idea is that when marginalized groups can generate and analyze data about their own lives and surroundings, they gain the knowledge and agency to advocate for themselves. This approach aligns with principles of epistemic justice, seeking to make knowledge production more equitable and inclusive [2]. CDE aims to transform passive data subjects into active problem-solvers within their communities.
However, marginalized communities often lack access to usable data for innovation, due to both resource and systemic barriers. Simply making data “open” or available is not enough if people don’t have the tools, skills, or power to leverage it [3]. Gurstein’s [4] classic critique of open data noted that access is “insufficient if there is a significant set of financial, skill, or other barriers to actually making effective use of that data”. In other words, without deliberate support, open data tends to “empower the empowered” while excluding the poor and marginalized. All too often, data relevant to underserved areas is either not collected, not disaggregated, or not shared in a useful format [5]. Even when data is accessible, it may feel extractive—gathered by outsiders for reports, with little community input—which limits local agencies in using that information [6]. This gap in data access and capacity means marginalized groups are frequently left out of innovation cycles and decision-making. They struggle to advocate for resources or policy changes because they lack evidence to back up their lived experiences. A “data divide” persists: those already privileged can harness data for progress, while low-income communities are data-rich in problems but data-poor in actionable insights [7].
Paradoxically, the current generation of urban poor is not “tech-blind” at all; even in informal settlements and slums, residents increasingly use smartphones and social media. For example, a field study in an Indian slum found virtually every household had access to a mobile device, and many people spent several hours per day on apps like YouTube and TikTok [8]. Fieldwork conducted by the author in March 2025 confirms similar patterns in Kampung Gedong Pompa, an informal riverside settlement in North Jakarta, Indonesia. When local teenagers were asked about their digital habits, most explained that they now rely on large-language-model chatbots more frequently than search engines, using them to complete homework and even to share personal concerns. This suggests that the community is technologically up to date and eager for information.
The primary obstacle is not access to devices but the form and channel of data communication. Residents in Kampung Gedong Pompa reported that research findings feel credible when presented during community gatherings, often held at the mosque or the neighborhood chief’s house, while everyday news circulates through WhatsApp. Yet trust in WhatsApp has diminished because of widespread hoaxes [9], and younger respondents said they prefer concise visual content on Instagram. Given the community’s wide range of literacy levels, text-heavy reports fail to engage most residents. Infographics, pictorial narratives, and short videos convey complex information quickly, and distributing them on trusted, high-engagement platforms leverages existing digital habits while mitigating misinformation.
Designing data communication systems around these preferences is essential. Visually appealing, platform-appropriate content can transform passive information into actionable knowledge, encouraging residents to participate in local decision-making and problem-solving. It is also important to use culturally attuned visual narratives so that residents can readily understand [10]. However, effectiveness is not merely about attractive visuals; it is about presenting information in ways that compel people to act. Only by sharing data creatively and systematically can it shift from something to know into something to do.
Building on this principle, the present study examines effective data-communication formats in Campana-Altamira, an informal settlement in northern Mexico facing intertwined social and environmental challenges. Through workshops and classroom visits with local teenagers, the author collected short reflective essays, audio recordings, and profile mapping exercises. Analysis of these materials produced behavior-based profiles showing how young residents perceive their neighborhood, prioritize issues, and imagine change.
The inquiry is guided by several key research questions that emerged from the problem statement:
- Which data formats and channels most effectively prompt residents, particularly teenagers, to engage in community problem-solving?
- How can behavior-based profiling be translated into design heuristics that nudge collective action?
- Why is an external, design-led intervention useful at the early stage, and how can it seed sustainable, locally driven innovation?
The goal is to spark grassroots innovation from within the community itself. By making data relevant and actionable for every resident, whether a teenager, shopkeeper, or community elder, we aim to trigger small yet meaningful acts of problem-solving. When information is presented in ways that feel tangible and connected to daily challenges, it can motivate anyone in the settlement to propose ideas, rally neighbors, and launch low-cost experiments. These locally seeded initiatives, nudged by accessible data, can accumulate into broader changes that steadily improve life in Campana-Altamira.
Despite these challenges, Campana-Altamira retains a strong sense of identity and belonging, often described as a "vocation of barrio." Surveys indicate that 90.6% of residents express pride in their neighborhood [35]. Women in particular play a critical role in driving social and physical change. They frequently lead neighborhood councils and civil society organizations, gaining empowerment and visibility through active participation [33].
In response to these complex issues, the Campana-Altamira Initiative was launched, beginning in 2013 with involvement from Tecnológico de Monterrey and formalized in 2015 through a comprehensive plan [32]. This initiative is a multi-sectoral partnership involving state and municipal governments, Tecnológico de Monterrey, and private sector collaborators. Its goal is to improve residents’ quality of life by promoting innovation, co-responsibility, trust, and resilience. The governance model described in the Integral Plan emphasizes horizontal, integrated, and coordinated decision-making through consensus among members of the Interinstitutional Council. However, despite this design, the social sector—representing community members—has been absent from this council, limiting direct community influence over strategic decisions. Participation has often been limited to consultation and the legitimization of decisions already made by institutional and private actors.
While the initiative has gathered extensive and detailed data about the community, there is little evidence that this data is meaningfully returned to residents or owned by them. Given that 24.8% of the population is considered to experience educational lag [34], data literacy is presumed to be low. This underscores the hypothesis that while much data has been extracted from the community, it has rarely been presented back in ways that empower local understanding or decision-making.
In parallel, in 2015, Tecnológico de Monterrey and Chiba University began the Post Urban Living Innovation (PULI) Program. Initially, the program did not focus on Campana-Altamira but worked on other design themes [35]. The thematic focus of PULI changes every five years. In 2023, the program adopted the Campana-Altamira intervention as its case study. As a design school initiative, the early stages focused on identifying what could be designed for the community.
By mid-2024, the approach shifted toward co-design with teenagers [36]. Engagement with local teenagers revealed that they possessed far more nuanced knowledge and insight than anticipated. Their contributions proved meaningful to the project’s development. This realization led to a new focus on integrating young people into the community-building process. The long-term goal is to nurture problem-solving mindsets among teenagers so they can contribute as future community innovators and leaders.
This project remains ongoing. Workshops are currently conducted twice a year, complemented by visits to participating universities. Plans are also underway to establish a maker’s lab in the community. Additional workshops are scheduled for the coming year. Findings from this research will directly inform the upcoming workshops, specifically testing data communication strategies designed to engage and motivate Campana-Altamira’s teenagers in local problem-solving efforts.
3.2. Speculative Profile Mapping Exercise
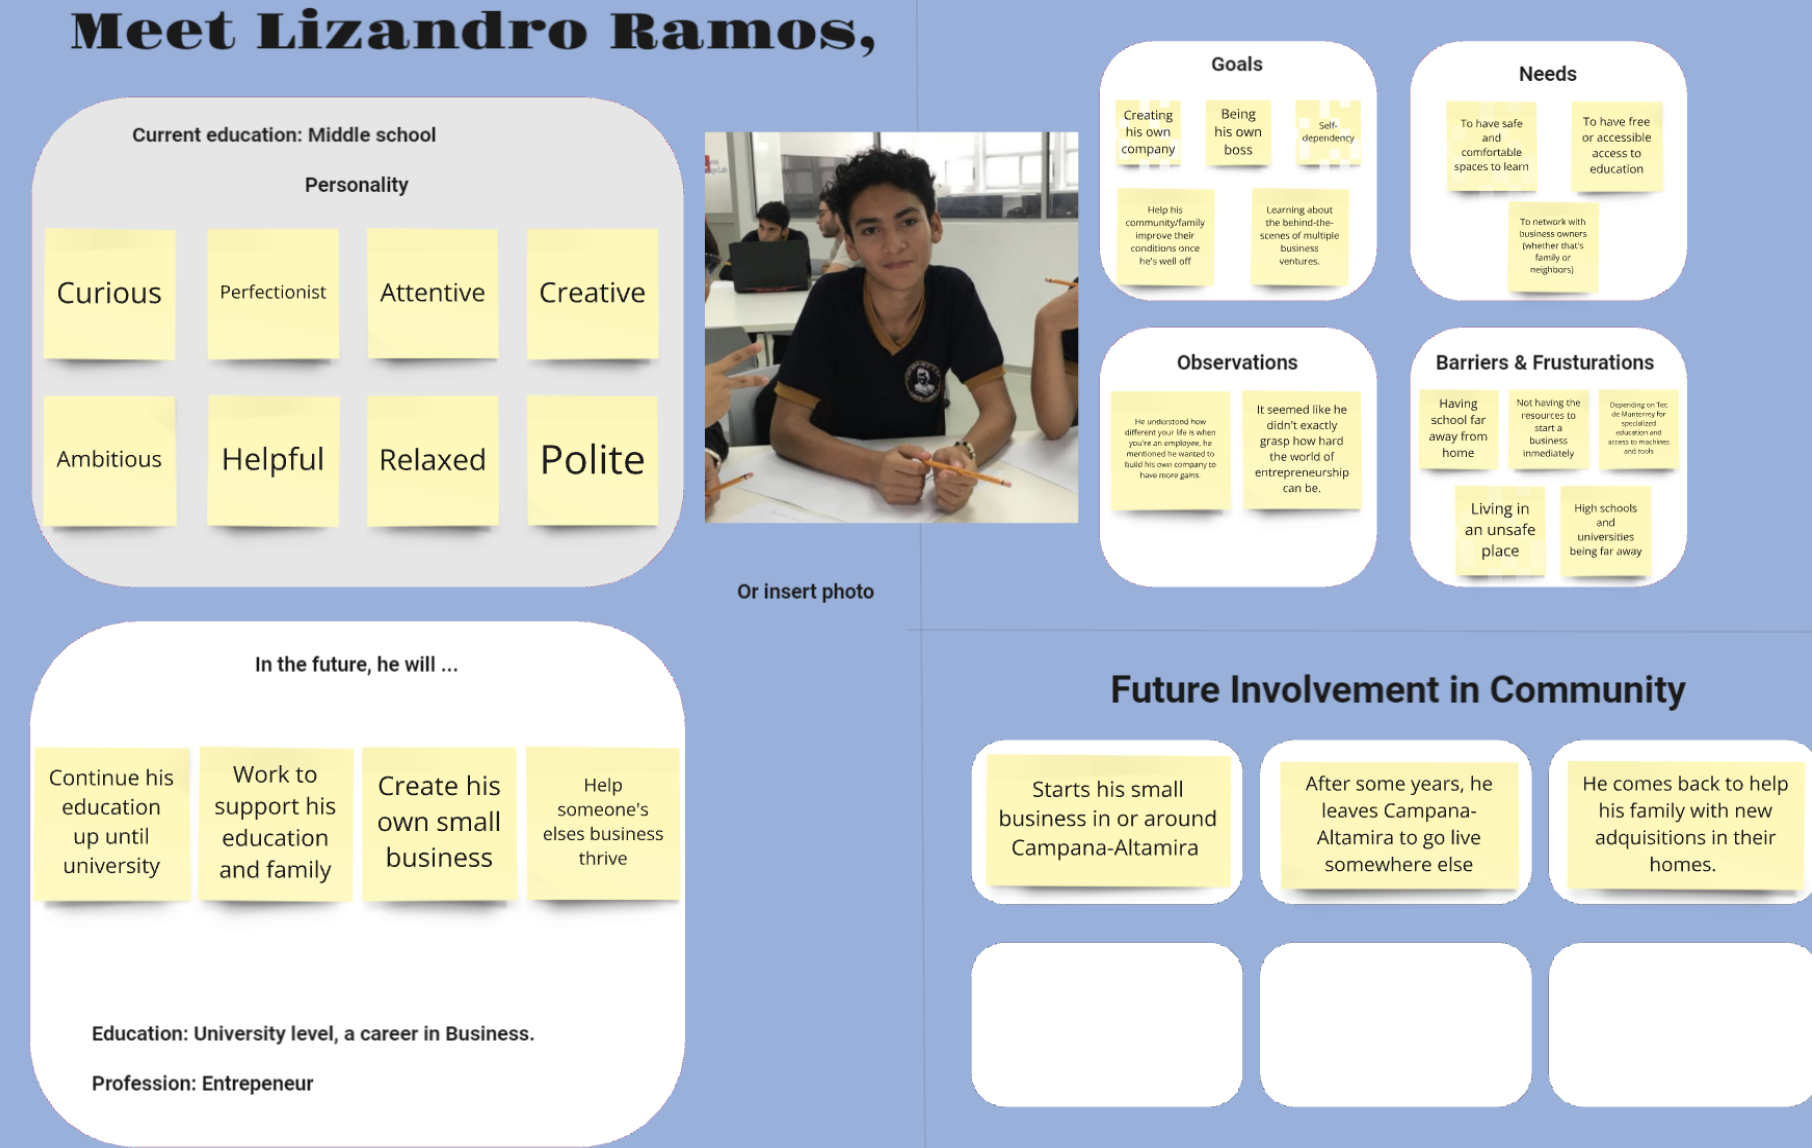
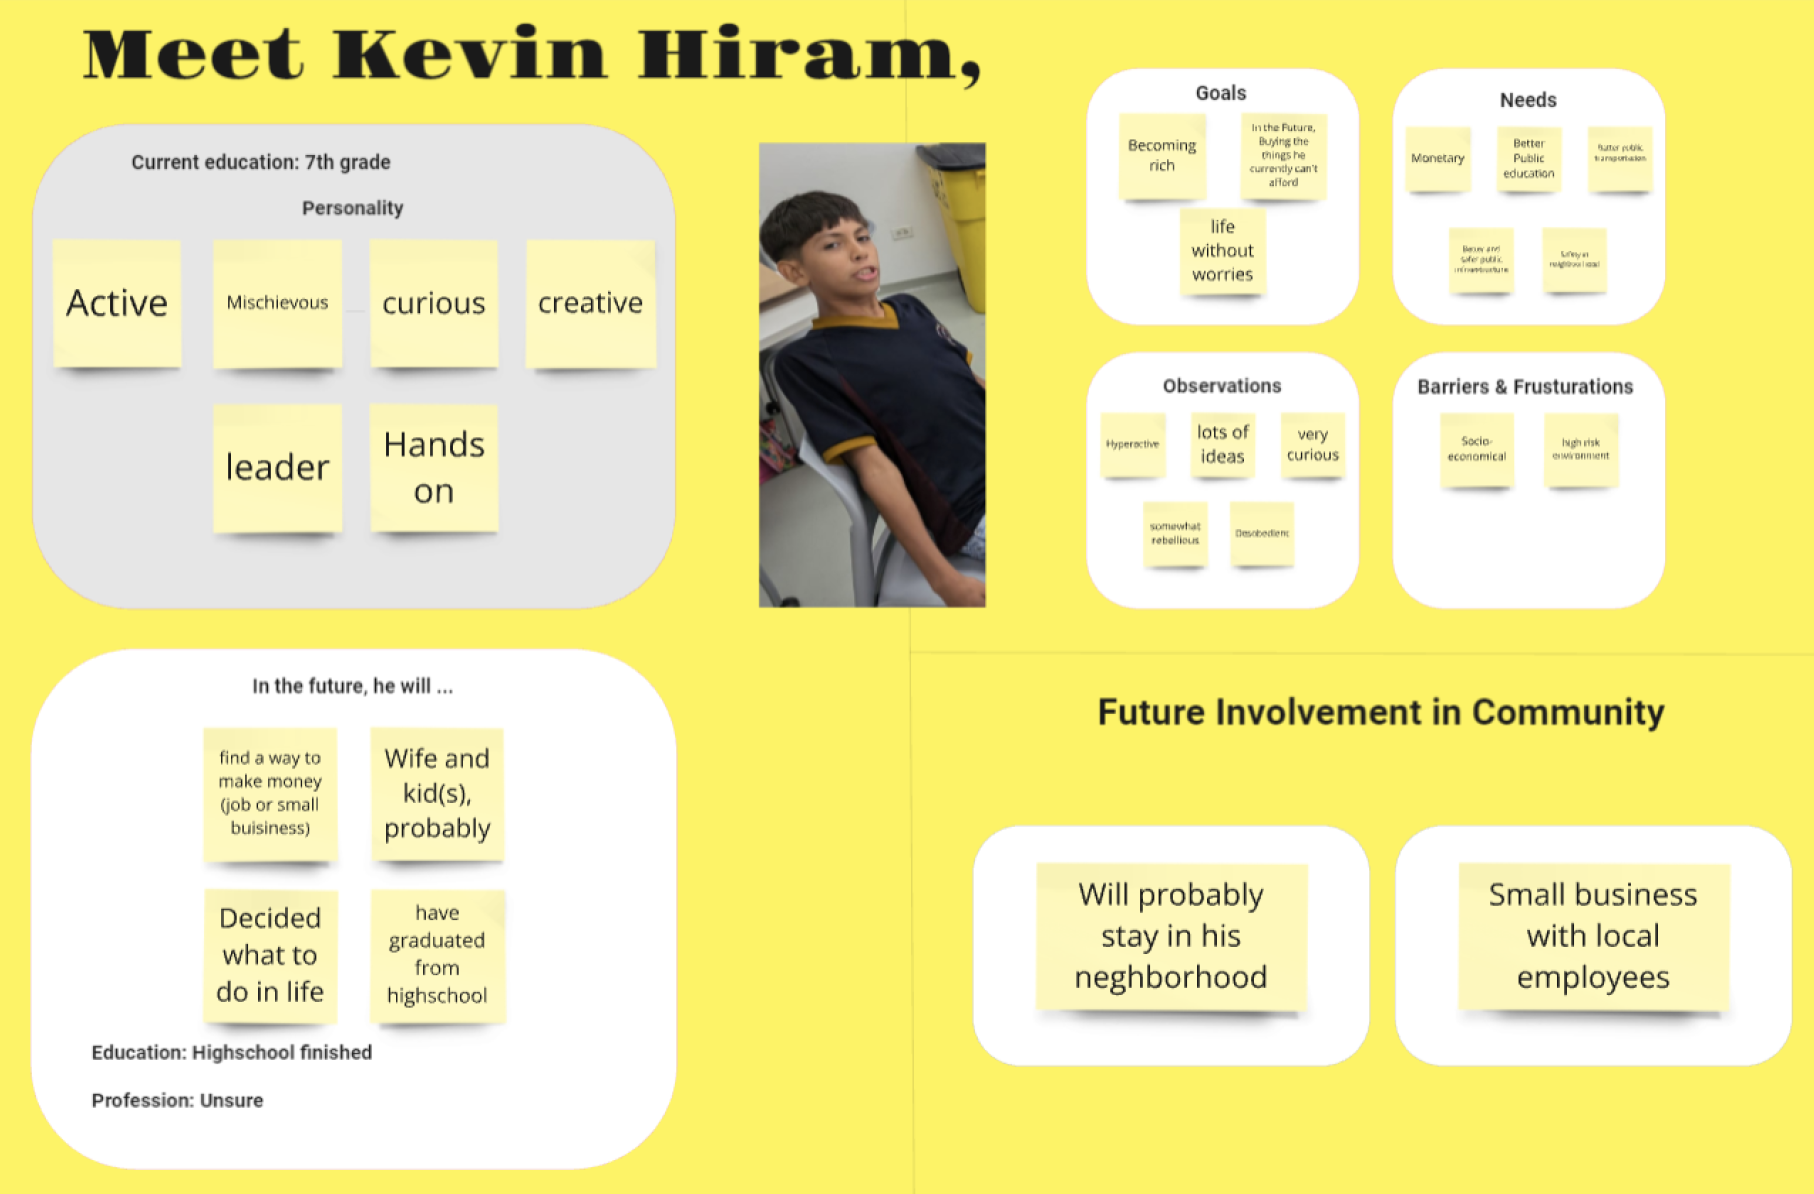
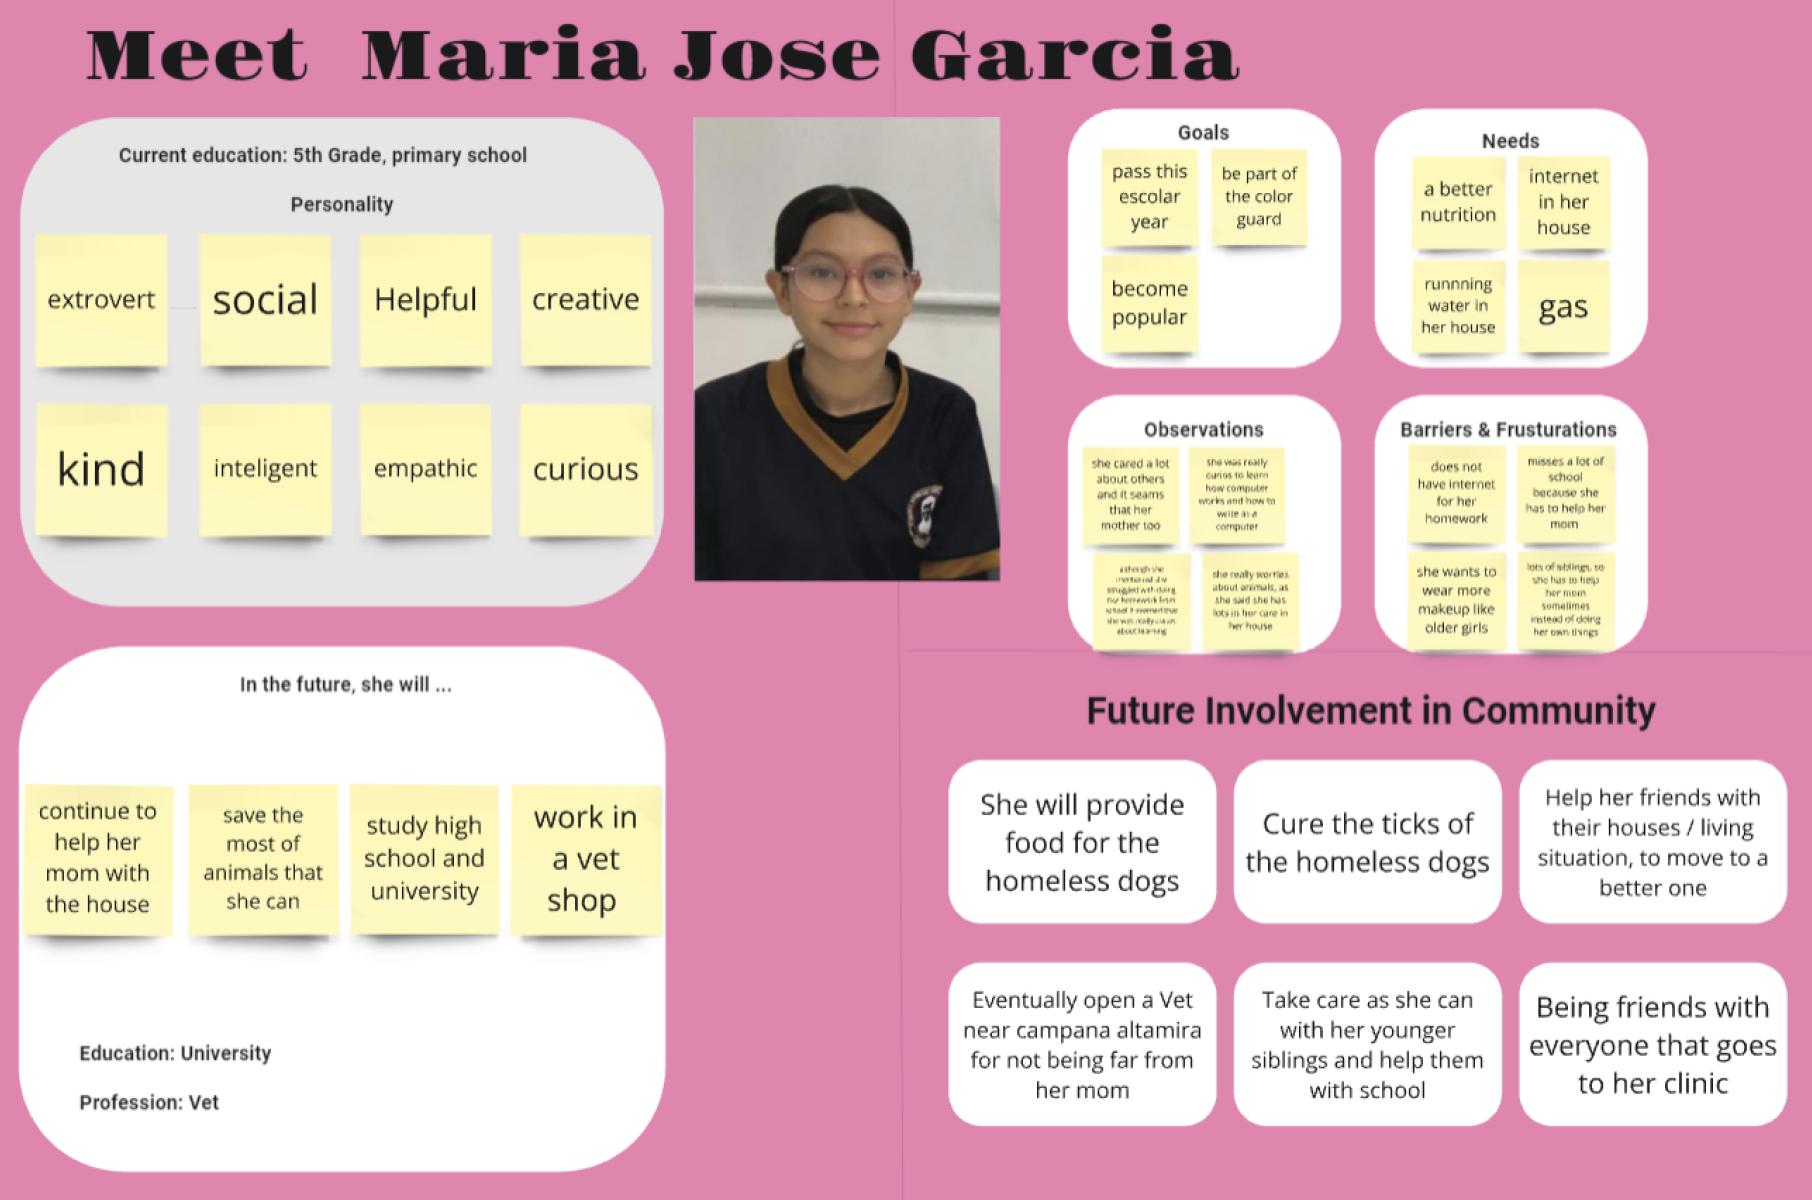
The Speculative Profile Mapping tool (Figure 2) was developed by the authors to project plausible future paths based on observed behaviors and attitudes. Its purpose is to help educators, researchers, and practitioners better understand students’ contexts by imagining how they might grow to contribute to their community.
This tool was introduced after the first engagement with teenage participants from Campana-Altamira to deepen understanding of their potential development trajectories. In the follow-up workshop held approximately one month later, students from Tecnológico de Monterrey who had participated in the initial engagement were asked to complete the mapping exercise. This approach was designed to maintain continuity in insights while recognizing the limited time available for direct interaction with the community.
However, the exercise is inherently subjective and comes with important limitations. The profiles were created by university students who, although they speak the same language, are not from Campana-Altamira and may lack a nuanced understanding of the teenagers’ real behaviors and motivations. Additionally, because the teenagers were visiting a university setting, they may have presented themselves in an idealized way, complicating efforts to interpret their typical behavior.
Participation in the original co-design workshop was selective, requiring teenage students to bring 100 bottle caps as proof of commitment. This requirement likely attracted self-selected participants who were highly motivated and aware of the value of experiencing a university environment. As a result, the insights generated may not reflect the average Campana-Altamira student but instead those with stronger intrinsic motivation or aspirations.
Despite these limitations, Speculative Profile Mapping serves as a valuable design and planning tool. It encourages stakeholders to move beyond standardized solutions and consider more nuanced, contextually appropriate interventions. By developing hypothetical yet plausible profiles, educators and researchers can anticipate students’ future needs, challenges, and opportunities. This approach is grounded in the principles of speculative design and human-centered pedagogy, emphasizing empathy, cultural relevance, and a forward-looking perspective. Ultimately, SPM supports the strategic planning of interventions that aim to foster both individual growth and broader community development in Campana-Altamira.
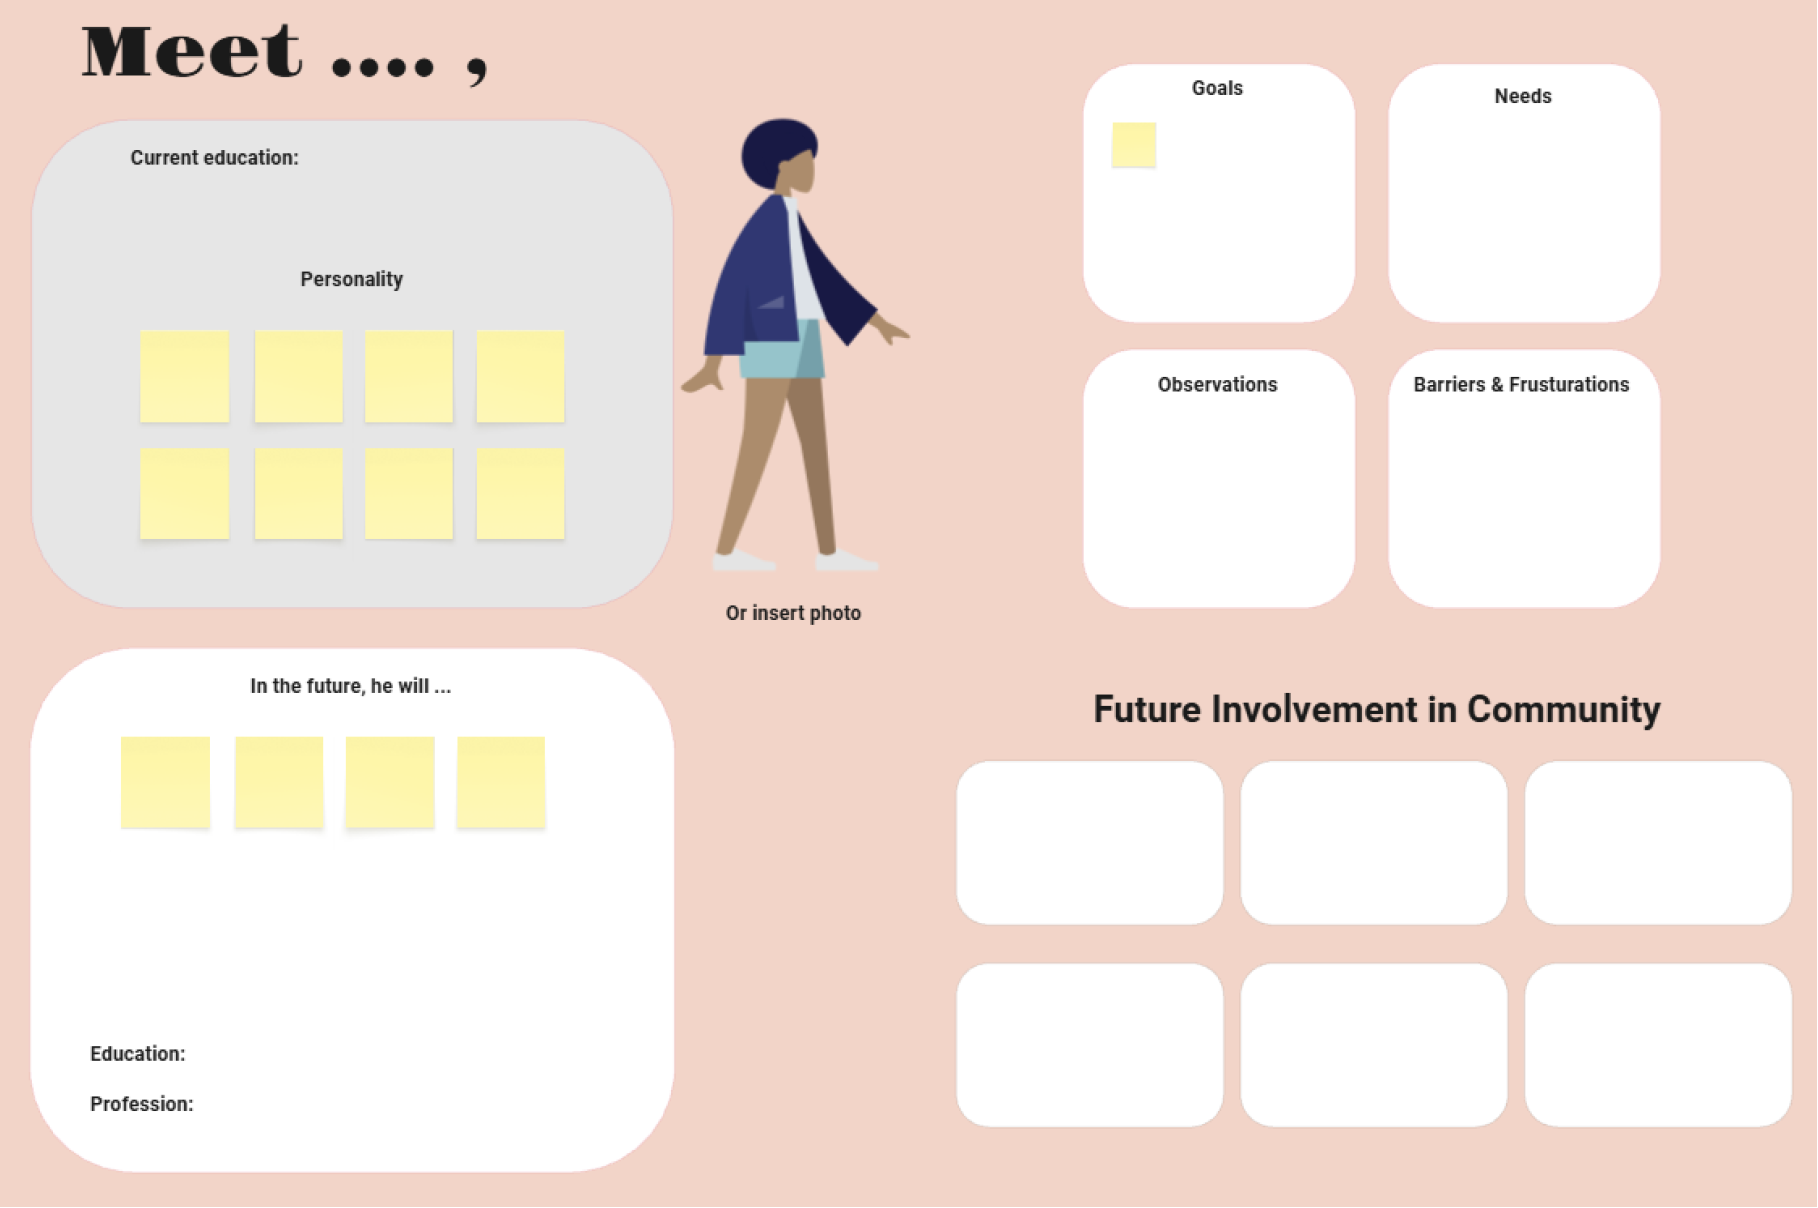
The Speculative Profile Mapping exercise included several structured columns designed to capture a holistic view of each participant. These columns recorded current educational status and observed personality traits. From workshop interactions and observations, the mapping also documented students’ stated goals in life, expressed needs, behavioral tendencies during activities, and perceived barriers or frustrations. Moving beyond these present-focused details, the exercise aimed to speculate about each teenager’s future by interpreting their conversations and interactions during the co-design sessions. This future-oriented section considered their likely individual paths, such as the projected highest level of education attained and potential professions, as well as anticipated forms of community involvement.
The results of this mapping process yielded revealing patterns (Figure 3). For the personality dimension, five out of six students were described as creative, while four were noted as curious. The group displayed an even split between introverted and extroverted tendencies, with three students characterized as shy and reserved and three others as more social and outgoing. Notably, one student exhibited clear leadership tendencies, marked by extroversion and active efforts to bring friends into the project, but was speculated to complete only high school. Another student, described as polite and ambitious, was viewed as the most likely to leave the community to pursue opportunities elsewhere. In contrast, two students were considered likely to remain in Campana-Altamira despite being projected to complete university studies, citing the desire to stay close to family. Job speculations included one potential entrepreneur, one tattoo artist, one office worker, one veterinarian, and two students with undetermined futures. The mapping also highlighted shared needs among participants, such as daily necessities including water, money, reliable transportation, and improved access to education.
3. Case Study: Campana-Altamira
3.1. Site and Initiative Context
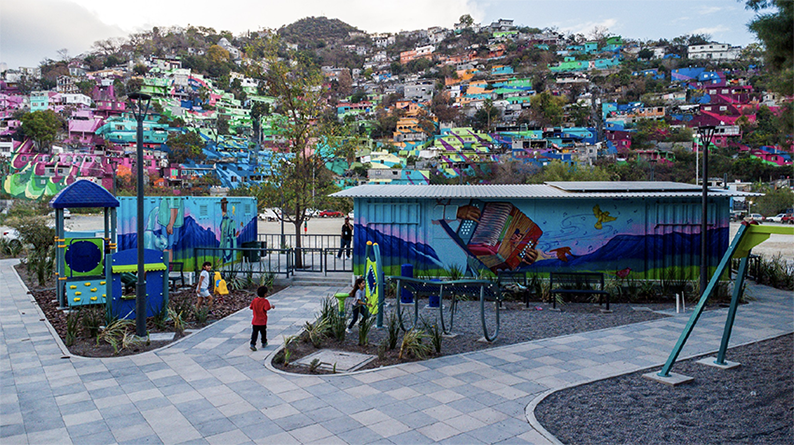
The Campana-Altamira site (Figure 1) is located in the south of Monterrey, Nuevo León, Mexico, encompassing 15 neighborhoods with over 20,000 residents [31]. The area’s population began expanding in the 1960s, driven by rural-to-urban migration to Monterrey [32]. Early settlers collaboratively transformed the hillsides to establish homes and basic services, building informal accessibility networks in the face of initial institutional abandonment [33]. The community was further challenged by a period of drug-related violence between 2006 and 2014, which deeply impacted local safety and social cohesion [32]. While the population is predominantly young, Campana-Altamira faces severe socio-economic challenges, with a poverty rate of 96% and 39% of residents reporting insufficient income to cover basic food needs [31]. Despite high water service coverage (96.50%), residents in higher hillside areas often rely on clandestine connections [32]. Public lighting and waste management are also limited in elevated zones that garbage trucks cannot access, and only 45.94% of street fronts have sidewalks.
1. Theoretical Framework
At its core, data literacy encompasses the ability to read, understand, create, and communicate data effectively. It is increasingly recognized as a critical skill in the 21st century, necessary not only for personal development but also for community engagement and empowerment [11, 12]. The integration of locally-based technical intermediaries can facilitate this empowerment by providing access to data in ways that are relevant to the community [13]. Data literacy increases individuals’ capacity to solve organizational problems and participate actively in community affairs [14]. Data-informed culture culminates in communities that effectively articulate their needs and advocate for resources that address local issues [15].
The challenge of achieving comprehensive data empowerment in various communities lies in addressing the disparities in access and knowledge. Research emphasizes that disadvantaged groups often lack access to essential resources needed to develop data literacy skills [16, 17]. Therefore, initiatives aimed at increasing data literacy must be well-designed to include these populations and create pathways for them to engage with data meaningfully. This could involve employing communication tools tailored to demystify complex data concepts, making this knowledge more accessible [18].
One of the core principles of CDE is that data initiatives should be participatory. This could mean co-designing data projects with community members or holding forums where residents interpret data findings together [19]. Participatory approaches also extend to the tools used. For example, Public Participation Geographic Information System (PPGIS) provides mapping technologies in a community-friendly way, so that residents can visualize local issues (like housing, resources, or hazards) and influence policymaking [20]. The idea behind PPGIS is explicit empowerment: it broadens public involvement in spatial decision-making and includes those normally excluded by combining expert GIS tools with local knowledge [21].
Another participatory tool is the Data Walk method [22]. A Data Walk is an interactive exercise where community stakeholders literally “walk” through presentations of data (often set up as stations or posters), discussing findings in small groups and adding their interpretations. This process demystifies data by removing technical jargon and inviting residents to make sense of the numbers. Such inclusive practices strengthen data literacy and trust: community members are not passive subjects but co-creators of insights.
Crucially, digital inclusion is both a goal and a means of CDE. Digital inclusion means ensuring all segments of the community—especially marginalized groups—are represented and heard in data processes [23]. For instance, disaggregating data by gender, ethnicity, or neighborhood can uncover inequities that aggregate statistics hide. But inclusion goes beyond data collection: it requires involving communities at each stage, from deciding “what to count” to determining how data is used.
Another pillar of the theoretical framework is a human-centric approach to data, often referred to as data humanism. Giorgia Lupi [24] introduced Data Humanism as a “second wave” of data visualization that reconnects numbers with the people, context, and stories behind them. From this perspective, effective data communication isn’t about flashy infographics or oversimplified charts; it’s about conveying complexity in a relatable way that resonates with human experience. Lupi argues that whenever the goal of data visualization is to open people’s eyes to new insights, some level of complexity and nuance is not only acceptable but necessary. In other words, real-world phenomena are multifaceted, especially in community settings—and our data presentations should embrace that complexity rather than “dumb it down.” Data Humanism calls for personalized, context-rich narratives instead of one-size-fits-all. For community empowerment, this means framing data in ways that community members find meaningful and relevant. Rather than treating data as abstract and impersonal, a human-centered lens presents data as stories of their community—each statistic linked to lived realities, behaviors, and values.
This approach also aligns closely with principles of data justice [25] and data activism [26]. Social justice activism in the data realm insists that data be used with communities, not against them. Data activism entails using data to highlight inequalities and demand accountability from powerholders. It is pro-people in its ethos: data is not viewed as cold numbers, but as a tool to empower those who might otherwise be voiceless. For instance, civil society groups have compiled open datasets on police violence or environmental pollution in marginalized areas as evidence to support community campaigns. Such initiatives embody both data humanism and CDE: they frame data around human welfare and equip communities with information to advocate for their rights.
Empowering a community with data also requires understanding the behavioral and motivational patterns within that community. CDE calls for a deeper examination of what drives different people within the community. Because this research focuses on teenagers, we adopt alternative approaches to interpret behavioral tendencies. We draw insights from unexpected fields, such as motivational profiling in game design [27]. Bartle’s taxonomy of gamer types (originally developed for online games) classifies players into four motivation-based categories: Achievers, Explorers, Socializers, and Killers [28]. Achievers are driven by accomplishment and rewards, Explorers by discovery, Socializers by community interaction, and Killers by competition and winning. While this framework comes from gaming, the core idea is broadly applicable—people engage with systems (including civic or data systems) in different ways based on their intrinsic motivations. In a community context, some individuals might be “achievers” who respond to data that tracks progress toward goals (e.g., seeing a neighborhood improvement index increase), whereas others might be “explorers” who get engaged by discovering new insights from open data, or “socializers” who prefer collaborative data activities like hackathons or community mapping events. The point is that effective community data empowerment should not assume a monolithic audience. By acknowledging these motivational profiles, CDE efforts become more inclusive of different personalities and can incentivize broader participation.
Finally, an important theoretical insight underpinning CDE is that information alone does not automatically empower. Research in development and behavioral economics has identified three key conditions that must be met for data or information to effectively spur action [29]. In brief, the information must be relevant, the community must have the power to act on it, and there must be an incentive to act [30].
- Relevance: The data provided must matter to the community’s own priorities and be perceived as credible and specific to their situation. Information that is too abstract or unrelated to people’s daily concerns will be ignored.
- Power to Act: Having information is futile if the community lacks the capacity or opportunity to use it. “Power to act” means community members have the rights, skills, and organizational strength to translate data into action. This can be legal or institutional power (e.g., a community has representation in decision forums or the authority to make certain changes) as well as practical capacity (time, education, mobility to attend meetings, etc.).
- Incentive to Act: People must see a benefit or motivation to act based on the information. Even if data is relevant and people can respond, they might not act unless they feel a sufficient incentive—this could be a personal or collective payoff, avoiding harm, a sense of duty, or external pressure. Community engagement is bolstered when acting on data aligns with the community’s values or when they trust that their action will make a difference.
These three conditions echo longstanding insights into community informatics and behavioral theory. When they come together, information can catalyze change—Kosec and Wantchekon [29] found multiple cases where relevant information plus local power and incentives led to improved governance outcomes. However, in the context of marginalized communities, one or more of these ingredients is frequently missing. Data may be presented in a form that is irrelevant or too technical for the community’s context; or communities are kept at the periphery of decision-making, effectively denying them power to act on knowledge; or there is apathy and distrust born from long-term exclusion, undermining incentives to engage. CDE frameworks explicitly aim to fill these gaps. They stress framing data in locally relevant terms, building community capacity (through data literacy and governance structures that give communities a voice), and creating incentives for action (by linking data to tangible community benefits and feedback loops). By meeting the conditions of relevance, power, and incentive, data becomes not just information about the community, but a tool for the community—enabling what we call Community Data Empowerment in the fullest sense.
Conclusion
This study highlights the essential role that effective data communication plays in supporting community agency and self-determination. Data on its own does not empower communities if it remains abstract, technical, or disconnected from local realities. Instead, when data is communicated in ways that reflect community values and everyday experiences, it becomes a practical tool for identifying challenges, mobilizing resources, and shaping collective solutions.
The behavioral profiling exercise offered one way to make communication more meaningful. By asking students to describe their role models, we gained valuable insight into the narratives and motivations that shape how they understand effort, success, and social responsibility. This information is not merely descriptive; it can guide the design of communication strategies that resonate with different audiences. When profiling results are shared thoughtfully and used to plan participation, they help identify roles and activities that suit local talents and interests, opening space for peer mentorship, youth leadership, and new forms of community-led innovation.
These findings point to the need for more design-based, participatory approaches to data systems in marginalized settings. Rather than imposing standardized tools, practitioners and institutions should work with communities to co-create systems that respect local knowledge and motivations. This includes developing flexible formats such as visual storytelling, interactive dashboards, or analog workshops that can be adapted to varying levels of literacy and technological access. It also involves fostering sustained partnerships with schools, NGOs, and local governments to embed data literacy and participatory use into everyday community life.
Building participatory data systems is not only a technical challenge but also a social one. It requires us to view data not as an extractive process but as a shared resource that, when communicated well, can help communities become the designers of their own futures.
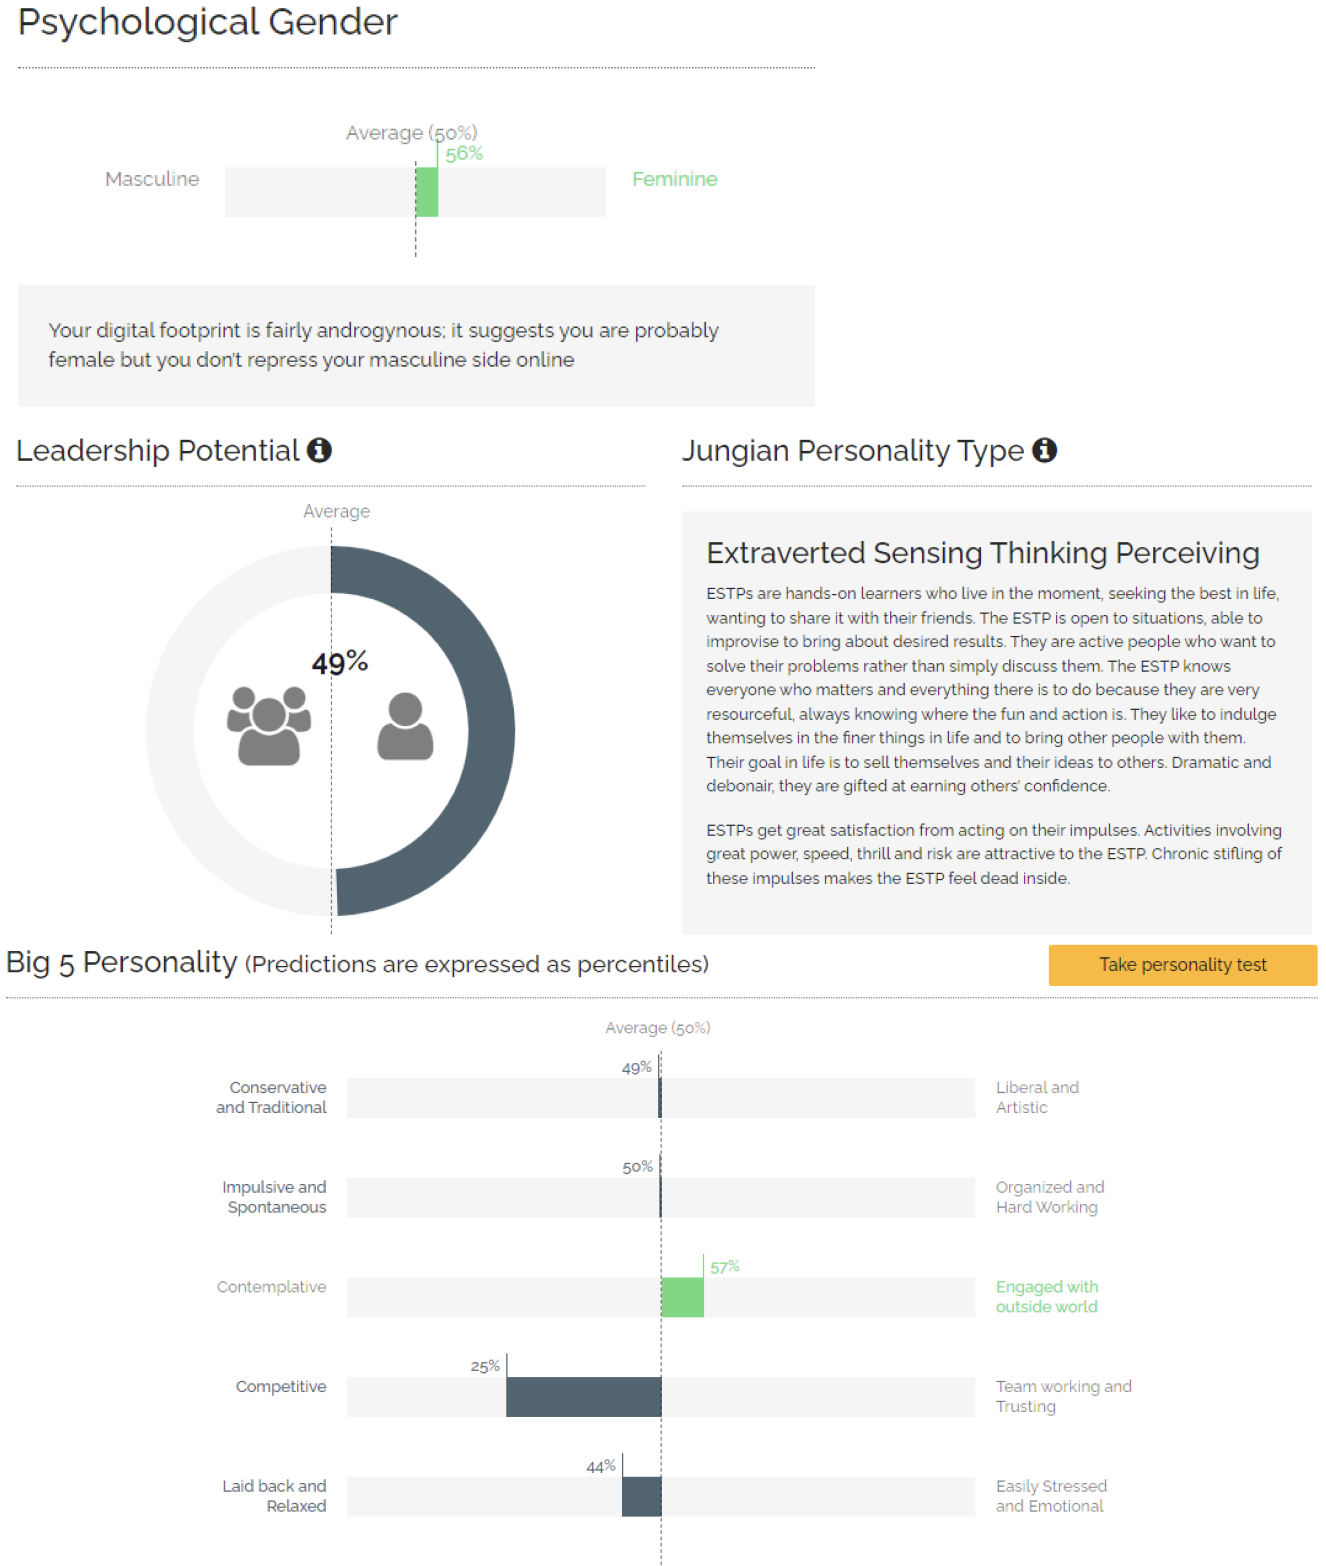
To analyze these texts, we employed the Apply Magic Sauce API developed by the University of Cambridge Psychometrics Centre (Figure 5). Apply Magic Sauce is an automated text analysis tool that predicts various psychological traits based on linguistic patterns in open-ended writing. It provides estimates of Big Five personality dimensions (Openness, Conscientiousness, Extraversion, Agreeableness, Neuroticism), leadership potential, gender expression tendencies, and other variables derived from social media and text inputs. While the model is trained on large-scale datasets and offers valuable indicative outputs, it is important to recognize its limitations, especially given the short length of these essays. Therefore, for this study, we excluded its Jungian personality type outputs, which returned implausibly uniform results (eight of ten students were assigned ISTP). Instead, we focused on more interpretable and relevant dimensions such as the Big Five traits, leadership potential, and masculine–feminine tendency.
These speculative profiles, while inherently interpretive and shaped by outsider perspectives, offer valuable insights into the diversity of motivations, aspirations, and potential trajectories within this small group of Campana-Altamira teenagers. The mix of creative, curious, introverted, and extroverted traits underscores that there is no single “type” of participant, challenging any assumption that youth in marginalized communities are a homogeneous group. Importantly, the exercise also highlights varying degrees of rootedness and mobility: some students envision futures firmly tied to family and community, while others see education as a path to opportunities beyond the neighborhood.
This diversity has practical implications for designing data communication and empowerment strategies. It suggests that one-size-fits-all interventions are unlikely to be effective. Instead, approaches must be adaptable to different personalities, ambitions, and social contexts. For example, students with leadership tendencies may be engaged as peer facilitators or ambassadors for community projects, while those with creative interests might respond better to visual storytelling or design-based activities. Similarly, recognizing the central role of daily needs such as water, money, and transportation can help ensure that data-driven interventions address issues that feel immediately relevant and actionable.
While limited in scale and shaped by subjective interpretations, the Speculative Profile Mapping exercise serves as an early step toward building a more nuanced understanding of the community’s youth. It offers a foundation for developing tailored, empathetic, and realistic strategies to support their involvement in local problem-solving efforts, paving the way for the next phase of this research: analyzing the Profile-Writing Exercise to further deepen these insights.
3.3. Profiling-Writing Exercise and Data Processing
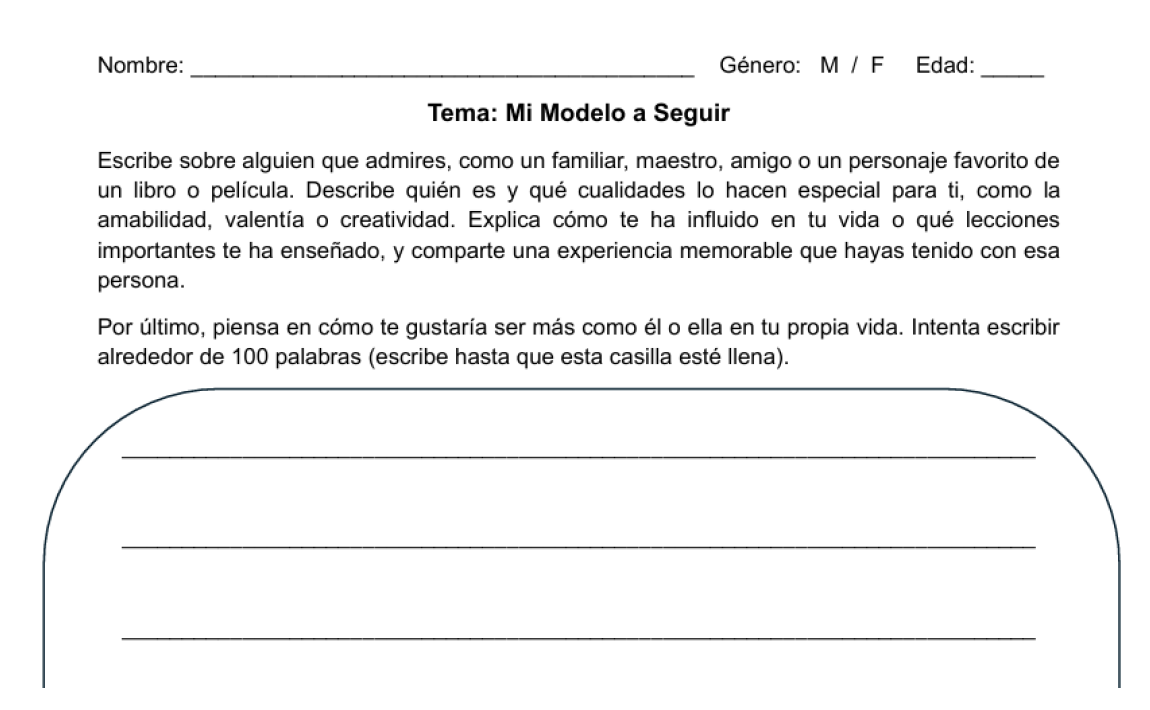
Four months after the initial co-design engagement workshop with the teenagers, we conducted a follow-up visit to their school. This choice of setting was especially important because it placed the students in an environment that felt more familiar and comfortable. Ten students who had participated in the earlier workshop were selected for this next phase. Each was asked to write a 100-word essay titled “Mi Modelo a Seguir” (My Role Model) (Figure 4).
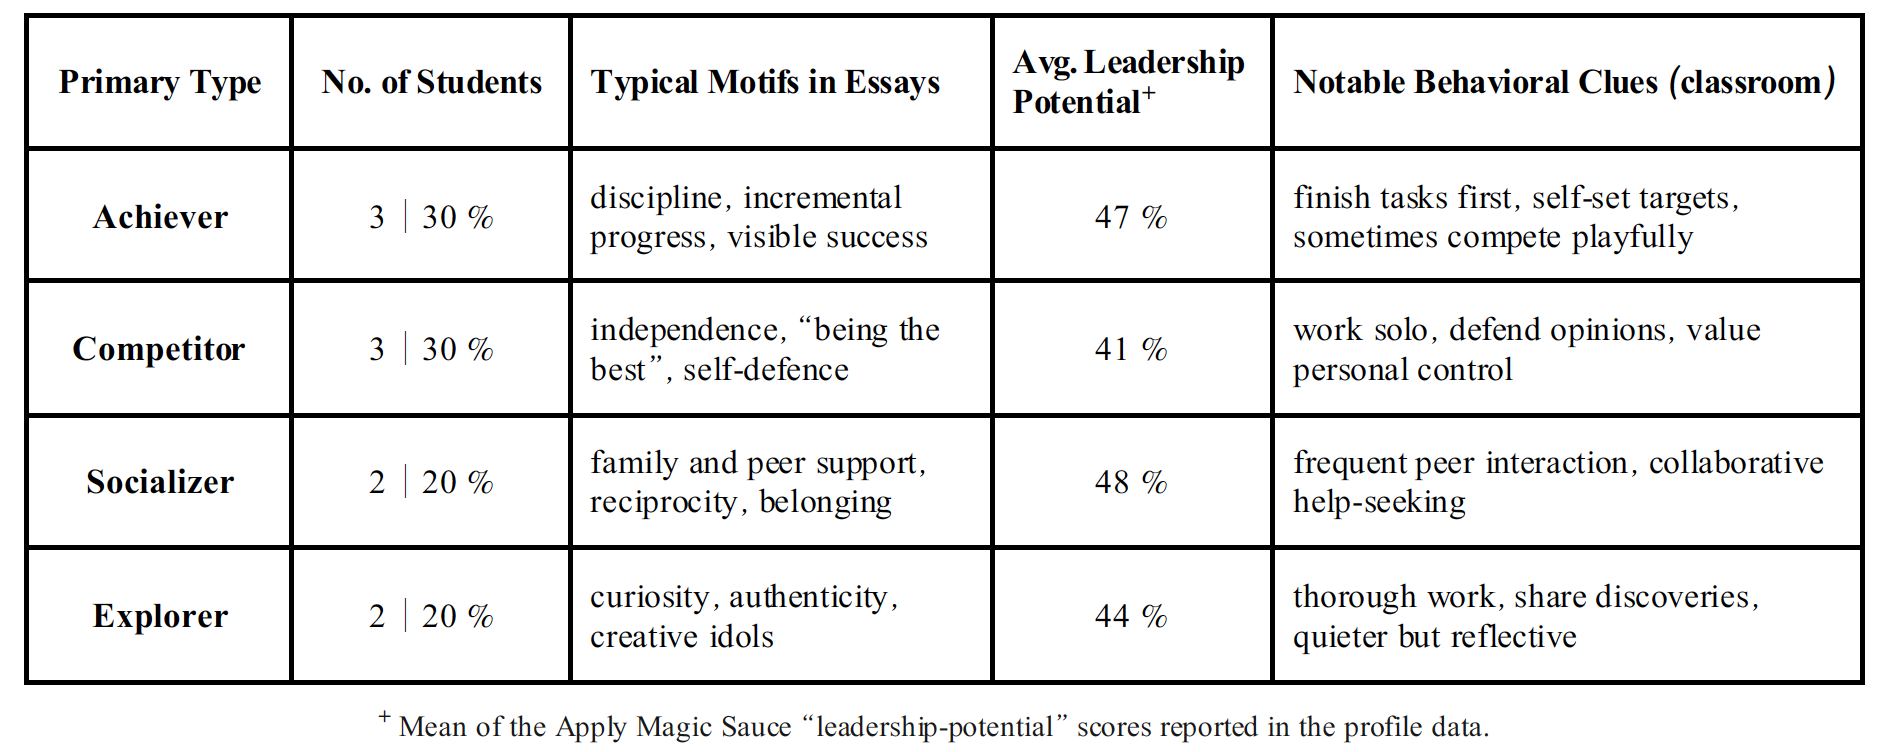
In addition to the Apply Magic Sauce analysis, we used a Large Language Model (ChatGPT) to support the categorization of each student’s essay into one of four personality orientations inspired by Bartle’s taxonomy of gamer types (Figure 6). Bartle’s original framework, developed to understand player motivations in online games, defines four types: Achiever, who seeks goals and measurable success; Explorer, who enjoys discovering new systems and possibilities; Socializer, who prioritizes relationships and collaboration; and Killer (renamed here as Competitor), who thrives on direct competition and outperforming others. Recognizing that “Killer” could sound overly aggressive or inappropriate for this context, we deliberately replaced it with “Competitor” to ensure the terminology would be more relatable and less intimidating for the students.
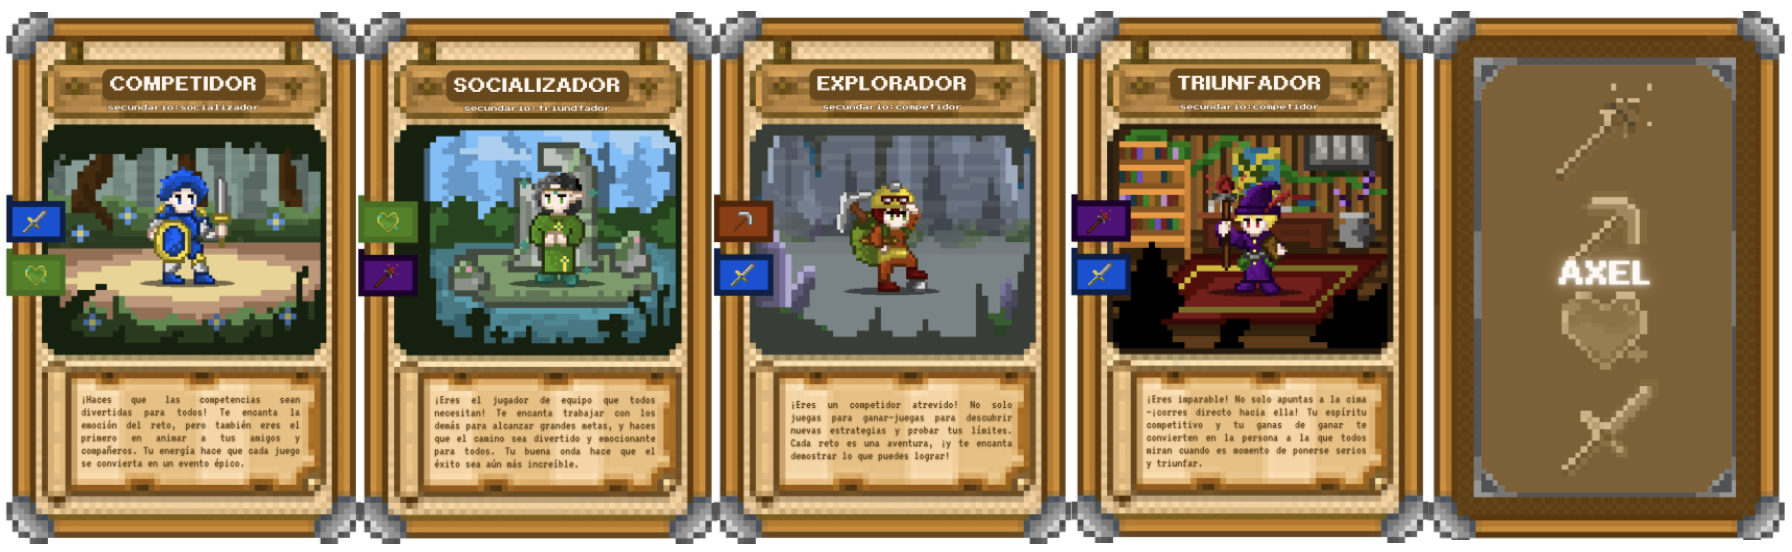
Before beginning the writing task, we explained to the students that their essays would be analyzed to place them into one of these four personality categories. We asked for signed consent from the students. We also invited them to guess their own type in advance. Interestingly, six out of ten students identified themselves as “Competitors.” This outcome made sense to some degree, given that these students were selected by teachers as some of the most engaged and ambitious in their cohort. However, it is equally plausible that peer influence played a role, with some students echoing the choices of friends rather than reflecting carefully on their own motivations. Unfortunately, due to the school schedule, we did not have the opportunity to return and share their categorized results before they graduated from middle school.
Because the raw writing samples alone might not fully capture nuanced motivational profiles, we used ChatGPT to assist in the analysis. As a form of prompt engineering, we developed specific instructions to guide the model’s interpretation, ensuring it would focus on the motivational cues relevant to Bartle’s framework while respecting cultural context. For example, a typical prompt used was:
"Read the following 100-word essay by a 13–15-year-old student from Mexico describing their role model. Analyze the text to determine which of these four motivational categories it most closely aligns with: Achiever (goal-driven, focused on personal success), Explorer (curious, enjoys discovery), Socializer (values relationships and support), Competitor (motivated by challenge and outperforming others). Explain the reasoning for your categorization in clear detail."
By using structured prompts like this, we aimed to make the categorization process transparent, consistent, and replicable.
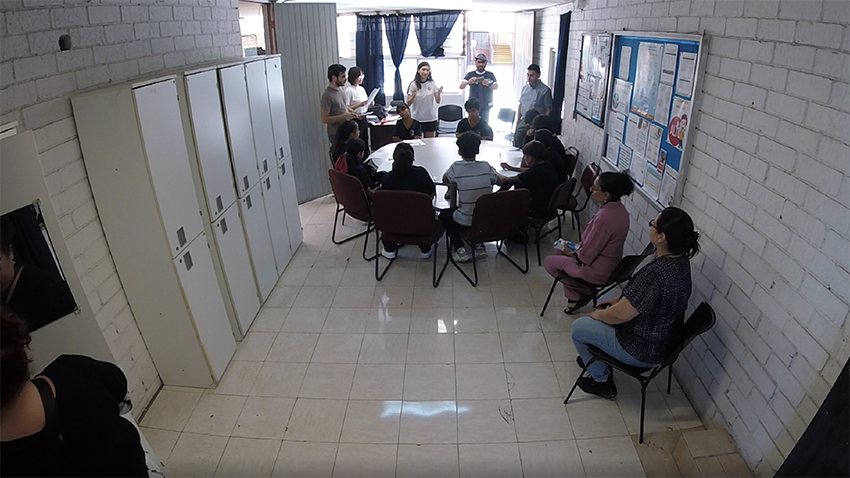
It is also worth noting that this data collection occurred in a highly supervised environment. During the writing period, teachers and the school principal were present, observing quietly from the back of the room (Figure 7). The students had 25 minutes to complete their essays. We documented their behavior both through direct observation in the classroom and with video recordings. These observations provided additional context for understanding social dynamics, peer interactions, and writing behaviors, all of which informed the interpretation of the profiling results.
The ten role model essays reveal a richly layered moral economy where ambition, attachment, and adversity constantly negotiate with one another. At first glance, the essays appear to differ widely. Some celebrate world-class athletes, others praise pop stars, and still others elevate parents or grandparents. Yet a closer reading shows that all ten writers share a single moral premise. Worth is earned, never granted, and it is earned through visible struggle that turns lack into competence. This premise is articulated through a story arc that every adolescent seems to know by heart: begin with few resources, cultivate discipline, endure social scorn or material scarcity, and eventually display mastery so clear that no one can deny it. Students cite Lionel Messi, Chris Bumstead, and Jungkook not because they possess rare talent, but because the students see in their biographies public confirmation that relentless effort converts disadvantage into respect. Even familial heroes are recast in this idiom. The grandmother who raised children alone becomes a solitary champion. The mother who balanced work and caregiving becomes proof that grit surpasses comfort. For data communication, this suggests that statistics that merely quantify deficits will fall flat. Numbers must narrate how deficits are transformed into progress.
The essays also reveal how success is situated within relationships. Three students focus almost exclusively on intimate connections, listing dozens of relatives by name. Six mention families only briefly before turning their attention to professional sport, bodybuilding, or music. Despite this difference in focus, every essay embeds the admired figure within a network of loyalty. The competitor who wants to be the best does so partly to honor a father who sacrificed for him. The socializer who treasures kin does so to mirror the generosity relatives showed her. Admiration is therefore a relational currency that circulates between generations, between peer groups, and between fans and idols. It is a reminder that success is a moral transaction as well as an individual outcome. This finding aligns with the principles of Community Data Empowerment, which emphasize that information gains power only when it travels within relationships of trust. A chart of water scarcity that relies on anonymous bars and percentages will communicate risk but not relational meaning. However, the same chart that incorporates the photograph of a local resident who fixed a pump failure will match the students’ internal logic that heroism must be validated by familiar people.
Emotional vocabulary further illustrates this relational logic. The language of the Achiever subgroup relies on verbs of progress such as lograr (achieve), cumplir (comply), and alcanzar (reach). Competitors prefer verbs of force such as luchar (struggle) and demostrar (demonstrate). Socializers emphasize ayudar (help) and querer (to want), while Explorers include verbs such as sentir (to feel) and descubrir (discover). Yet across all profiles, there is a constant return to the regulation of emotion: boosting self-esteem, controlling fear, and managing sadness when sick or alone. Emotion is not treated as a soft flourish but as a skill that enables action. Lionel Messi teaches the first writer not only how to be the best but also how to inspire courage. C-Bo’s lyrics become a daily source of confidence. The emotional dimensions of data design cannot be superficial or decorative. Dashboards and reports should embed micro-celebrations such as icons that light up when a neighborhood meets a target, or testimonial pop-ups that let a resident describe how a new bus route improved daily life. These small touches transform inert statistics into felt experience, reinforcing the belief that emotion is the ignition switch for behavior.
Gender nuances are subtle but important. Female Competitors frame independence in explicitly gendered terms, highlighting the importance of success without dependence on men. Male Competitors describe independence as triumph over rivals. Female Socializers often list long kin networks, while male Socializers mention a smaller circle of immediate relatives. This suggests that girls may interpret community data through a lens of relational security and collective support, while boys may focus more on individual ranking or progress. Designing materials with this in mind, such as family-tree visuals for girls or progress meters and milestones for boys, could make communication more engaging without putting students into stereotypes.
Patterns in classroom behavior strengthen this interpretation. Rapid finishers, mostly Achievers and Competitors, consulted peers briefly to verify word count or timing, then quickly returned to their writing. Slower, more talkative students, often Socializers and Explorers, transformed the same assignment into a collaborative exercise. They passed papers, counted words aloud, and helped each other brainstorm. Both styles were effective. Every student met or exceeded the 100-word requirement. This shows that a future data platform should offer parallel engagement modes. Solo missions that grant points for discovery will appeal to Achievers and Competitors. Collaborative quests that unlock shared rewards will resonate with Socializers and Explorers. Allowing students to switch between these modes validates both independent mastery and group problem-solving.
Leadership potential, as measured in the profiling exercise, averaged in the mid-40 percent range across the group. This is high enough to expect that students could act as peer facilitators, yet still low enough that structured mentoring and scaffolding will be necessary. Each motivational style offers a different contribution. Achievers bring decisiveness and initiative. Socializers contribute to facilitation and cohesion. Explorers offer creative ways to frame problems. Competitors supply energy and focus. A youth data club could rotate leadership roles accordingly: one month, an Achiever leads a metrics challenge, the next month a Socializer hosts a reflection circle, and then an Explorer curates a micro-museum of neighborhood history. This rotation would mirror the reciprocity the students already value and ensure that no single style dominates the conversation.
Perhaps the most striking commonality across all the essays is a quiet but persistent optimism. Structural scarcity is acknowledged but reframed as the starting point of heroism. None of the writers denies hardship, but all see it as a proving ground. In a neighborhood where nearly every family faces poverty, this reframing is a psychological survival strategy as much as a moral code. Data communication that highlights only unmet needs risks reinforcing resignation and helplessness. In contrast, communication that tracks small victories, cumulative improvements, and examples of resourcefulness will speak directly to this resilient worldview. Each incremental gain becomes further proof that scarcity is not destiny but raw material for progress.
Taken together, these essays portray a youth culture that blends ambition with collective validation, emotional literacy with pride in resilience, and everyday hardship with the conviction that better is always possible (Table 1). Any system that hopes to motivate this audience should translate data into stories of progress, tie abstract measures to recognizable people and places, embed emotional signals, and offer both competitive and cooperative ways to participate. This approach would not simply inform students but would resonate with the moral language they already use to transform obstacles into hope.
The key cross-cutting insights can be summarized as follows:
(A) Two dominant value clusters
Resilient individualists (Achiever + Competitor, 60 %) praise hard work, self-reliance, and visible mastery, while relationship builders (Socializer + Explorer, 40 %) emphasize emotional support, creativity, and shared experiences.
(B) Achievement is socialized, not solitary
Even highly competitive students mention role-model networks (coaches, family, fandoms). Conversational observations confirm that they exchange feedback while racing to finish first, suggesting that friendly competition co-exists with peer scaffolding.
(C) Support and justice themes are pervasive
Nine of ten essays reference overcoming adversity: poverty, hate, health, or heartbreak. Messages of “don’t depend on anyone” and “help each other rise” appear side-by-side. This signals a sweet communication spot: stories that pair self-efficacy with collective uplift.
(D) Moderate leadership headroom across the board
Average predicted leadership potential sits in the mid-40 %s, high enough to enlist students as data ambassadors yet low enough to profit from structured guidance. Competitors bring assertiveness; Socializers contribute facilitation skills; Explorers add novel framing; Achievers push momentum.’
(E) Low stress, high perseverance profile
Most texts scored slightly “laid-back” despite intense goals, and workshop notes show no task abandonment. Resilience narratives, therefore, ring true; interventions can safely incorporate stretching goals and timed challenges without undue anxiety.
What this means for data-communication design is as follows:
- Gamified progress trackers and challenge boards will resonate with Achiever-Competitors.
- Narrative, family-centric visuals, and peer discussion prompts will engage Socializer-Explorers.
- Mixed-modality sessions (short competitive sprints followed by cooperative reflection) mirror their natural blend of rivalry and support.
The next section translates these insights into concrete design heuristics for the community data system.
3.4. Data Communication System Recommendations for Campana-Altamira
The personality mapping exercise shows four motivational orientations among Campana Altamira teenagers: Achievers, Competitors, Socializers, and Explorers. Each group processes information through a distinct logic. Achievers track progress toward concrete goals, Competitors measure themselves against peers, Socializers look for relational meaning, and Explorers seek discovery and context. To turn community data into action, a communication system must speak fluently to all four logics at once.
3.4.1. Translating Metrics into Familiar Storylines
Every essay framed success as a hardship overcome through effort. Present data in the same grammar. Replace “forty percent of households lack safe drainage” with “Last month, ten families fixed overflow pipes; ten more repairs will give the entire street safe drainage.” This phrasing mirrors the students’ struggle-to-progress narrative and supplies an immediate next milestone for Achievers.
3.4.2. Anchor Abstractions in People That the Students Recognize
Profiles showed that teenagers validate success through relationships. Dashboards should feature local faces rather than anonymous icons. A water-usage graph can open with a short reel of a neighbor explaining how a simple valve repair cuts her carrying distance by half. Socializers will share and discuss the story, while Competitors will note the clear evidence of improvement.
3.4.3. Provide Dual Engagement Tracks
Classroom observations revealed two productivity styles. Fast-finishing Achievers and Competitors enjoy solo benchmarks; Socializers and Explorers prefer cooperative discovery. The platform, therefore, needs two parallel modes. A personal “My Progress” tab lets users collect badges for each report they file or repair they complete. A “Community Quest” tab lets groups unlock shared rewards, such as a street mural or a school celebration, when joint goals are met. Either mode updates the same master progress bar, so efforts converge.
3.4.4. Embed Emotional Signals
Students treat emotion as a resource. Small celebrations keep motivation high. When a block reaches a recycling target, push a celebratory sticker in the app and show a confetti animation on the public screen at the neighborhood center. A short congratulatory audio clip recorded by a peer leader can accompany the update. These micro-victories feed the confidence cycle named in the essays and keep momentum visible.
3.4.5. Match Media Channels to Literacy and Trust Cues
Instagram reels pair concise visuals with music, which suits Socializers and Explorers and avoids WhatsApp fatigue. Infographic posters displayed at the mosque and the neighborhood chief’s house can summarize weekly milestones for parents and grandparents who do not follow social media. Short voice notes circulated in existing WhatsApp groups can invite Competitors to beat the previous week’s repair tally. Using several channels ensures each motivational group receives information in its preferred format.
3.4.6. Build a Rotating Youth Ambassador Program
Leadership-potential scores average in the mid-forties, suggesting capacity but a need for scaffolding. Select one Achiever or Competitor as “data sprint captain” each month to set numeric goals; pair that student with a Socializer or Explorer who curates story content. Rotation satisfies competitive urges while keeping relational voices in the foreground.
3.4.7. Layer Complexity for Explorers Without Overwhelming Others
Explorers appreciate nuance. Provide an “advanced view” button under each indicator that opens a map with historical trends and optional links to external sources. Keep the default view simple—headline numbers and next steps—so Achievers, Competitors, and younger Socializers see clear calls to action.
3.4.8. Protect Autonomy and Agency
Competitors and Achievers value independence. Any data request should include a rationale and a visible payoff. For example, “Log three pothole photos to unlock the repair kit fund” signals that effort links directly to material change. Avoid requests that feel extractive or vague; otherwise, trust erodes.
3.4.9. Maintain a Feedback Loop
At the next school visit, share aggregate results with the students. Show how their reporting increased fixed rates or funding allocations. Closing the loop corrects the earlier missed opportunity and demonstrates that data truly cycles back to its producers. Periodic feedback also lets teenagers refine the system’s design, keeping it aligned with evolving motivations.
3.4.10. Start Small, Iterate Fast
Launch with two or three indicators that meet the relevance-power-incentive test. Measure water-line repairs, litter-free block counts, and volunteer hours. Observe which personality groups engage first, then expand. Rapid iteration keeps the system responsive and prevents feature bloat that could overwhelm users with low data literacy.
By turning personal motivations into design parameters—a solo badge track for Achievers and Competitors, collaborative quests for Socializers and Explorers, and emotionally charged micro-celebrations for everyone—the system converts raw community metrics into stories of attainable progress. Information becomes more than a record; it becomes a lever that teenagers already know how to pull.
4. Discussion: Designing Social Data Systems
This study suggests that simple, participatory profiling activities can meaningfully inform how we communicate data in marginalized communities. Asking students to write about their role models in their own words offered more than just biographical sketches; it revealed how they interpret success and perseverance in their context. Their essays consistently describe overcoming adversity through effort, discipline, and support. This narrative lens matters because it highlights that data is most compelling when it reflects local values and is framed as a story of progress rather than static need.
The profiling exercise also underscored the diversity of motivation among students. Some clearly responded to competition and personal goals, while others valued social connection or exploration. This variation suggests that data communication efforts should avoid a single, rigid format. Instead, they can benefit from multiple pathways to engagement. For example, competitive students might be drawn to clear targets or gamified challenges, while more socially oriented students could be engaged through group mapping projects or shared storytelling events. Interactive and layered formats allow different types of participants to find their own entry points.
Facilitation emerged as another critical consideration. The profiling workshop was most successful when it was introduced as a conversation, inviting students to share and guess their own types in an open, relaxed way. This approach lowered barriers and encouraged participation. Similarly, communicating data effectively in these communities will likely rely on creating trusted spaces for discussion, like school classrooms or neighborhood council meetings. In-person dialogue can help people make sense of data together, ask questions, and relate information to their own lives in ways that digital dashboards alone cannot.
Importantly, these strategies need to be adapted carefully to the context. What worked in Campana Altamira may not work in other communities with different cultural norms, literacy levels, or histories of engagement with data. Profiling is not a universal blueprint but a method for learning about local motivations and designing accordingly. Being mindful of these differences will be essential to avoid one-size-fits-all approaches that fail to resonate.
Based on these insights, several recommendations emerge. Data communication should prioritize storytelling over dry statistics, using familiar language, local examples, and relatable visuals. Tools should not just inform but invite action, making next steps clear and achievable, and celebrating small victories to build momentum. Blending digital and in-person communication can help bridge literacy gaps and build trust, while ensuring that data remains accessible to all community members.
Long-term strategies might include embedding data literacy into school programs, supporting youth-led clubs that focus on local issues, and developing partnerships with NGOs and local governments. Schools can provide a regular space for workshops and reflection. NGOs can support development and facilitation. Local governments can demonstrate respect for community knowledge by integrating resident-generated data into planning processes. Together, these partnerships can help move from seeing data as something extracted from communities to something shared, meaningful, and used to drive local problem-solving.
Share and Cite
Chicago/Turabian Style
Aristi, Savira, Hisa Martinez Nimi, Juan Carlos Chacon Quintero, Alejandro Martinez Baca, and Kenta Ono, "Leveraging Data Communication Systems to Empower Local Innovations in Marginalized Slum Communities through Behavioral Profiling." JDSSI 3, no.3 (2025): 54-79.
AMA Style
Aristi S, Martinez Nimi H, Chacon Quintero JC, Martinez Baca A, and Ono K. Leveraging Data Communication Systems to Empower Local Innovations in Marginalized Slum Communities through Behavioral Profiling. JDSSI. 2025; 3(3): 54-79.
© 2025 by the authors. Published by Michelangelo-scholar Publishing Ltd.
This article is published under the Creative Commons Attribution-NonCommercial-NoDerivs 4.0 International (CC BY-NC-ND, version 4.0) license (https://creativecommons.org/licenses/by-nc-nd/4.0/), which permits non-commercial use, distribution, and reproduction in any medium, provided the original work is properly cited and not modified in any way.
Email: mspl@michelangelo-scholar.com
Tel: +852-66761250
WHATSAPP:+60 11-2370 2845
Room A, 3/F, Wing Tat Commercial Building, 121–125 Wing Lok Street, Sheung Wan, Hong Kong, China


JDSSI
MSPL
JACAC
DH
JAUD